Testing the equality of mean densities of temperature in Vietnam
DANOVA.qmd
library(dda)
library(fda.usc)
library(fdANOVA)
library(MVN)
library(tidyverse)
library(boot)
library(sf)
set.seed(10983)
Preprocessing into density data
data(vietnam_temperature_dd)
data(vietnam_regions)
data(vietnam_provinces)

to_trend <- function(ddobj, t = seq_len(ncol(ddobj$coefs))) {
  ddobj$coefs <- lm(t(ddobj$coefs) ~ t)$coefficients["t", ]
  dd(clr = fd(ddobj$coefs, ddobj$basis))
}

vnt <- vietnam_temperature_dd |>
  group_by(region, province) |>
  summarise(t_max = list(c(t_max)), .groups = "drop") |>
  mutate(t_max = lapply(t_max, to_trend)) |>
  left_join(vietnam_regions, by = c("region" = "code")) |>
  rename(region_name = name) |>
  arrange(region, province)
class(vnt$t_max) <- c("ddl", "fdl", "list")

vnt |> plot_funs(t_max, color = region_name) +
  facet_grid(vars(str_wrap(region_name, 14)), scales = "free_y") +
  theme(legend.position = "none", axis.title.y = element_text(angle = -90)) +
  geom_hline(yintercept = 1 / diff(vnt$t_max[[1]]$basis$rangeval), linetype = "dotted") +
  labs(
    x = "Temperature (deg. Celsius)",
    y = "Density",
    color = "Region"
  )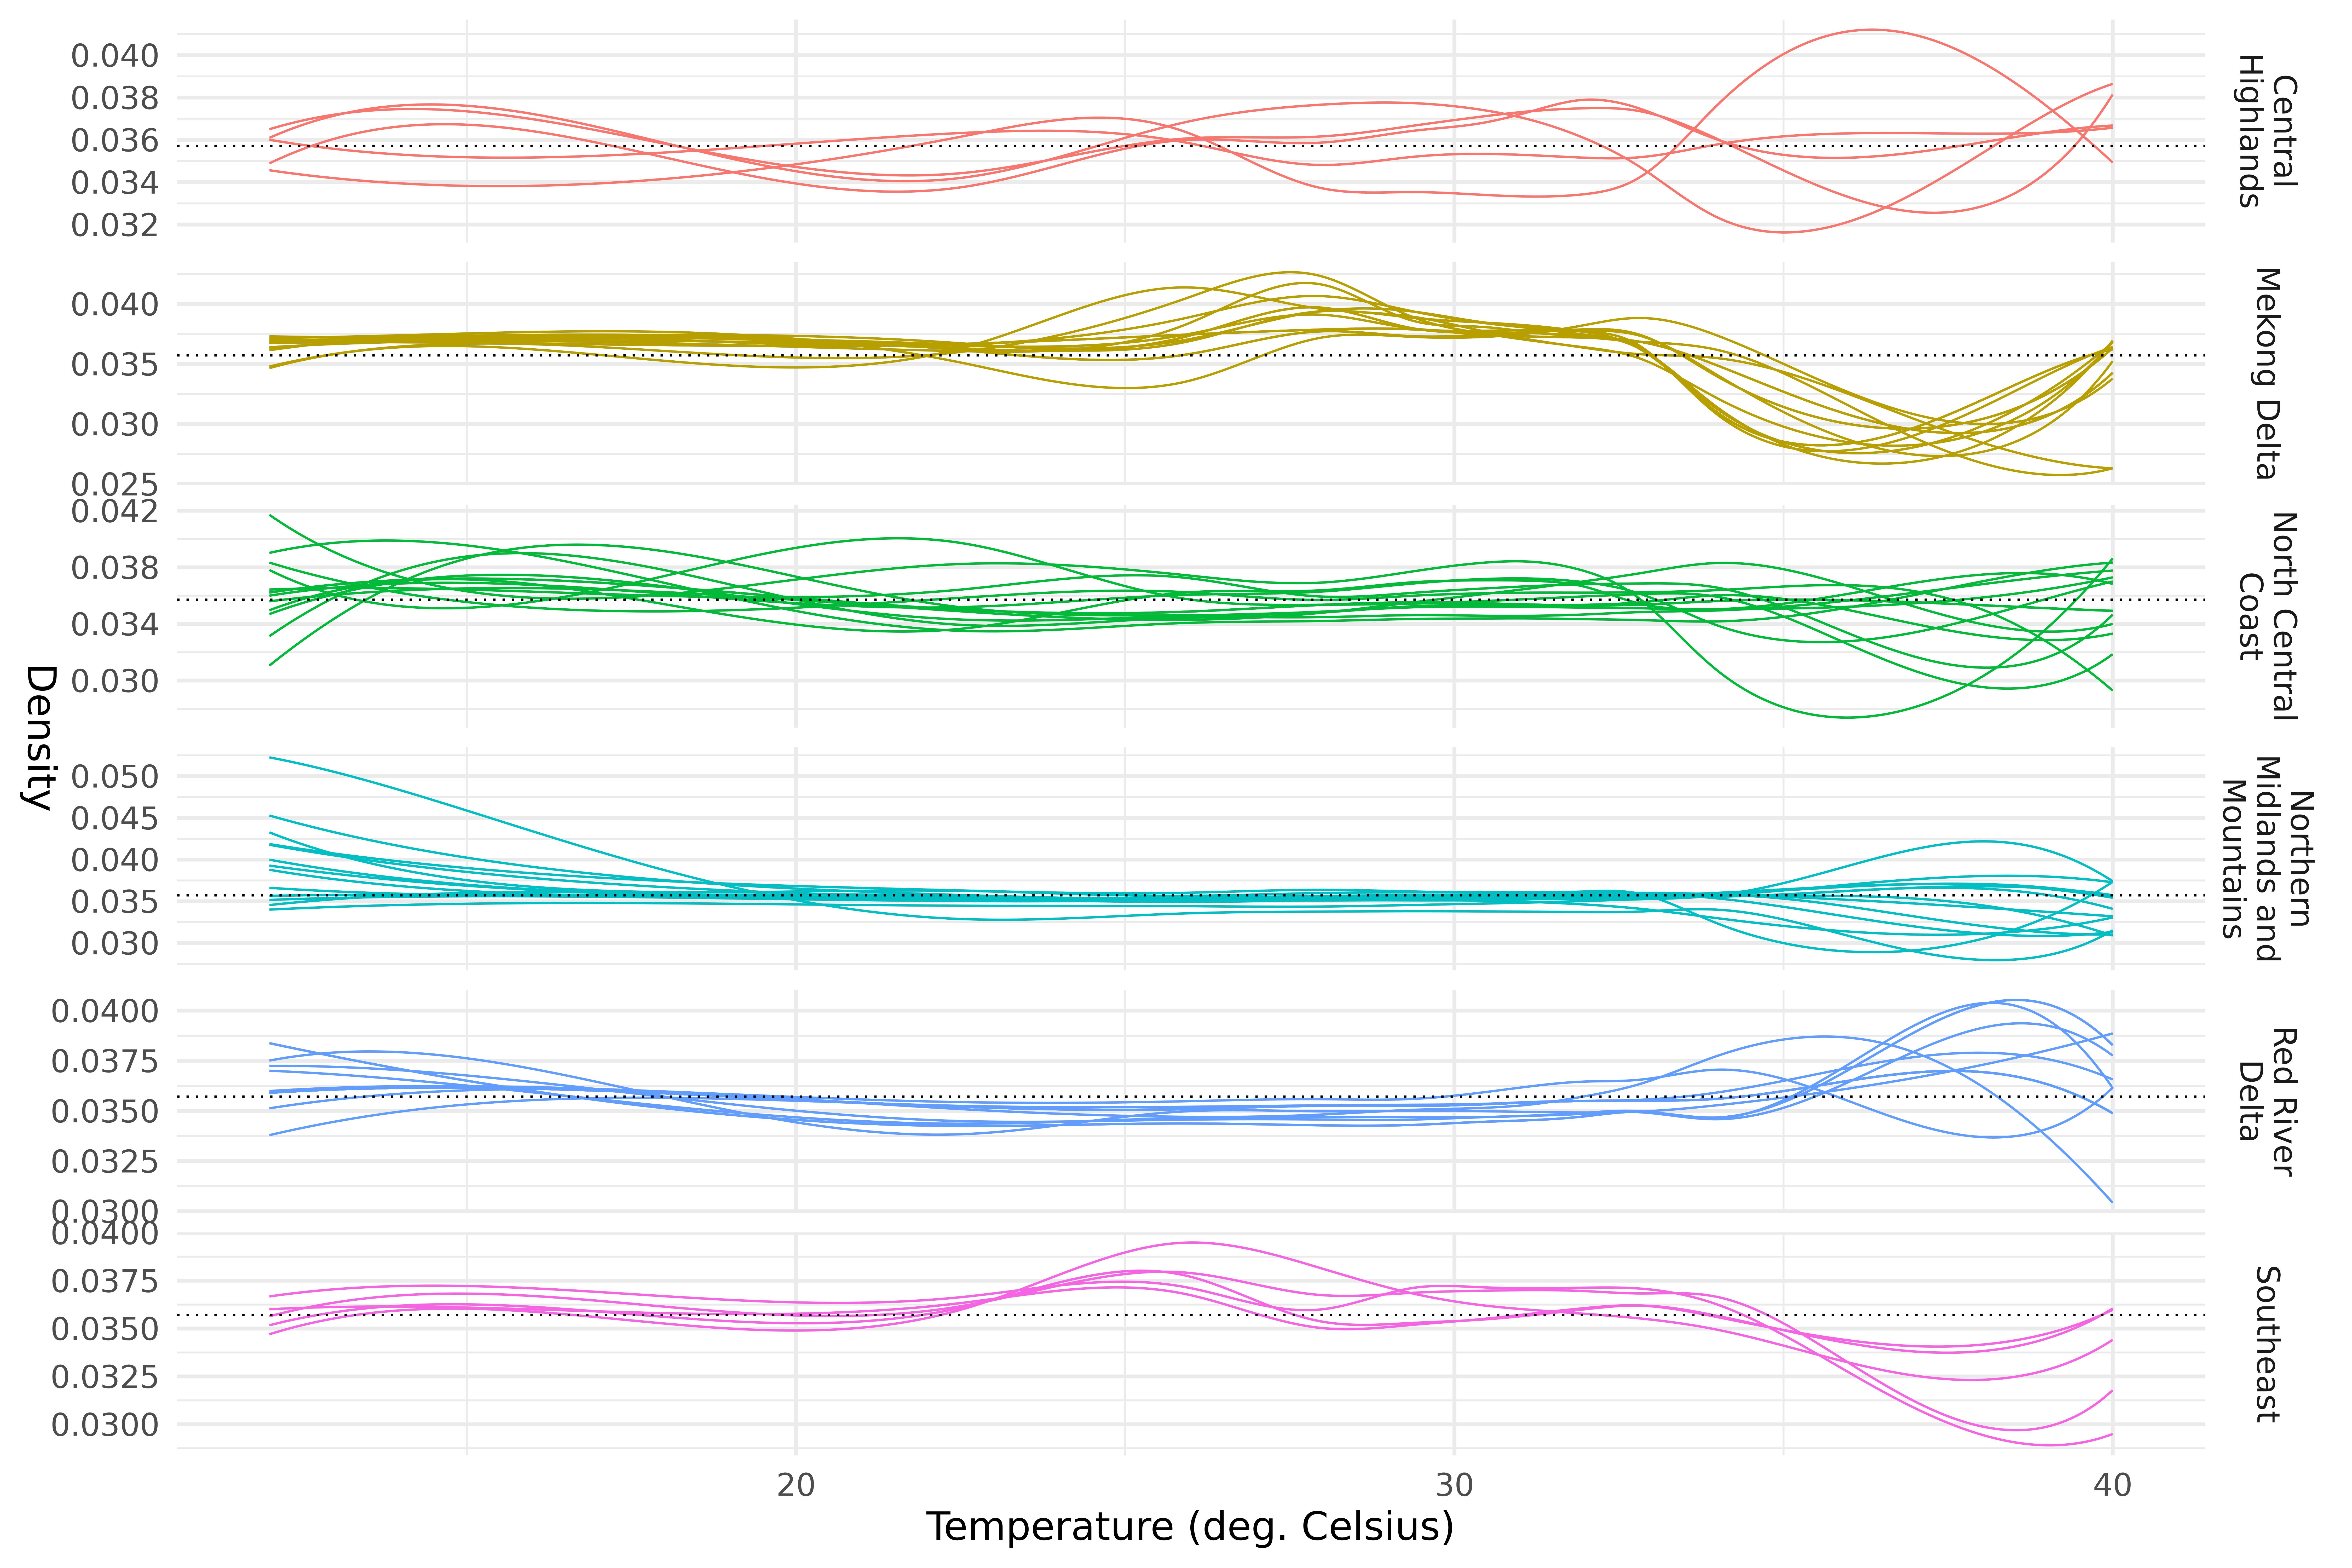
Density of maximum temperature per province.
vnt |> plot_funs(t_max, color = region_name) +
  theme_legend_inside +
  labs(
    x = "Temperature (deg. Celsius)",
    y = "Density",
    color = "Region"
  )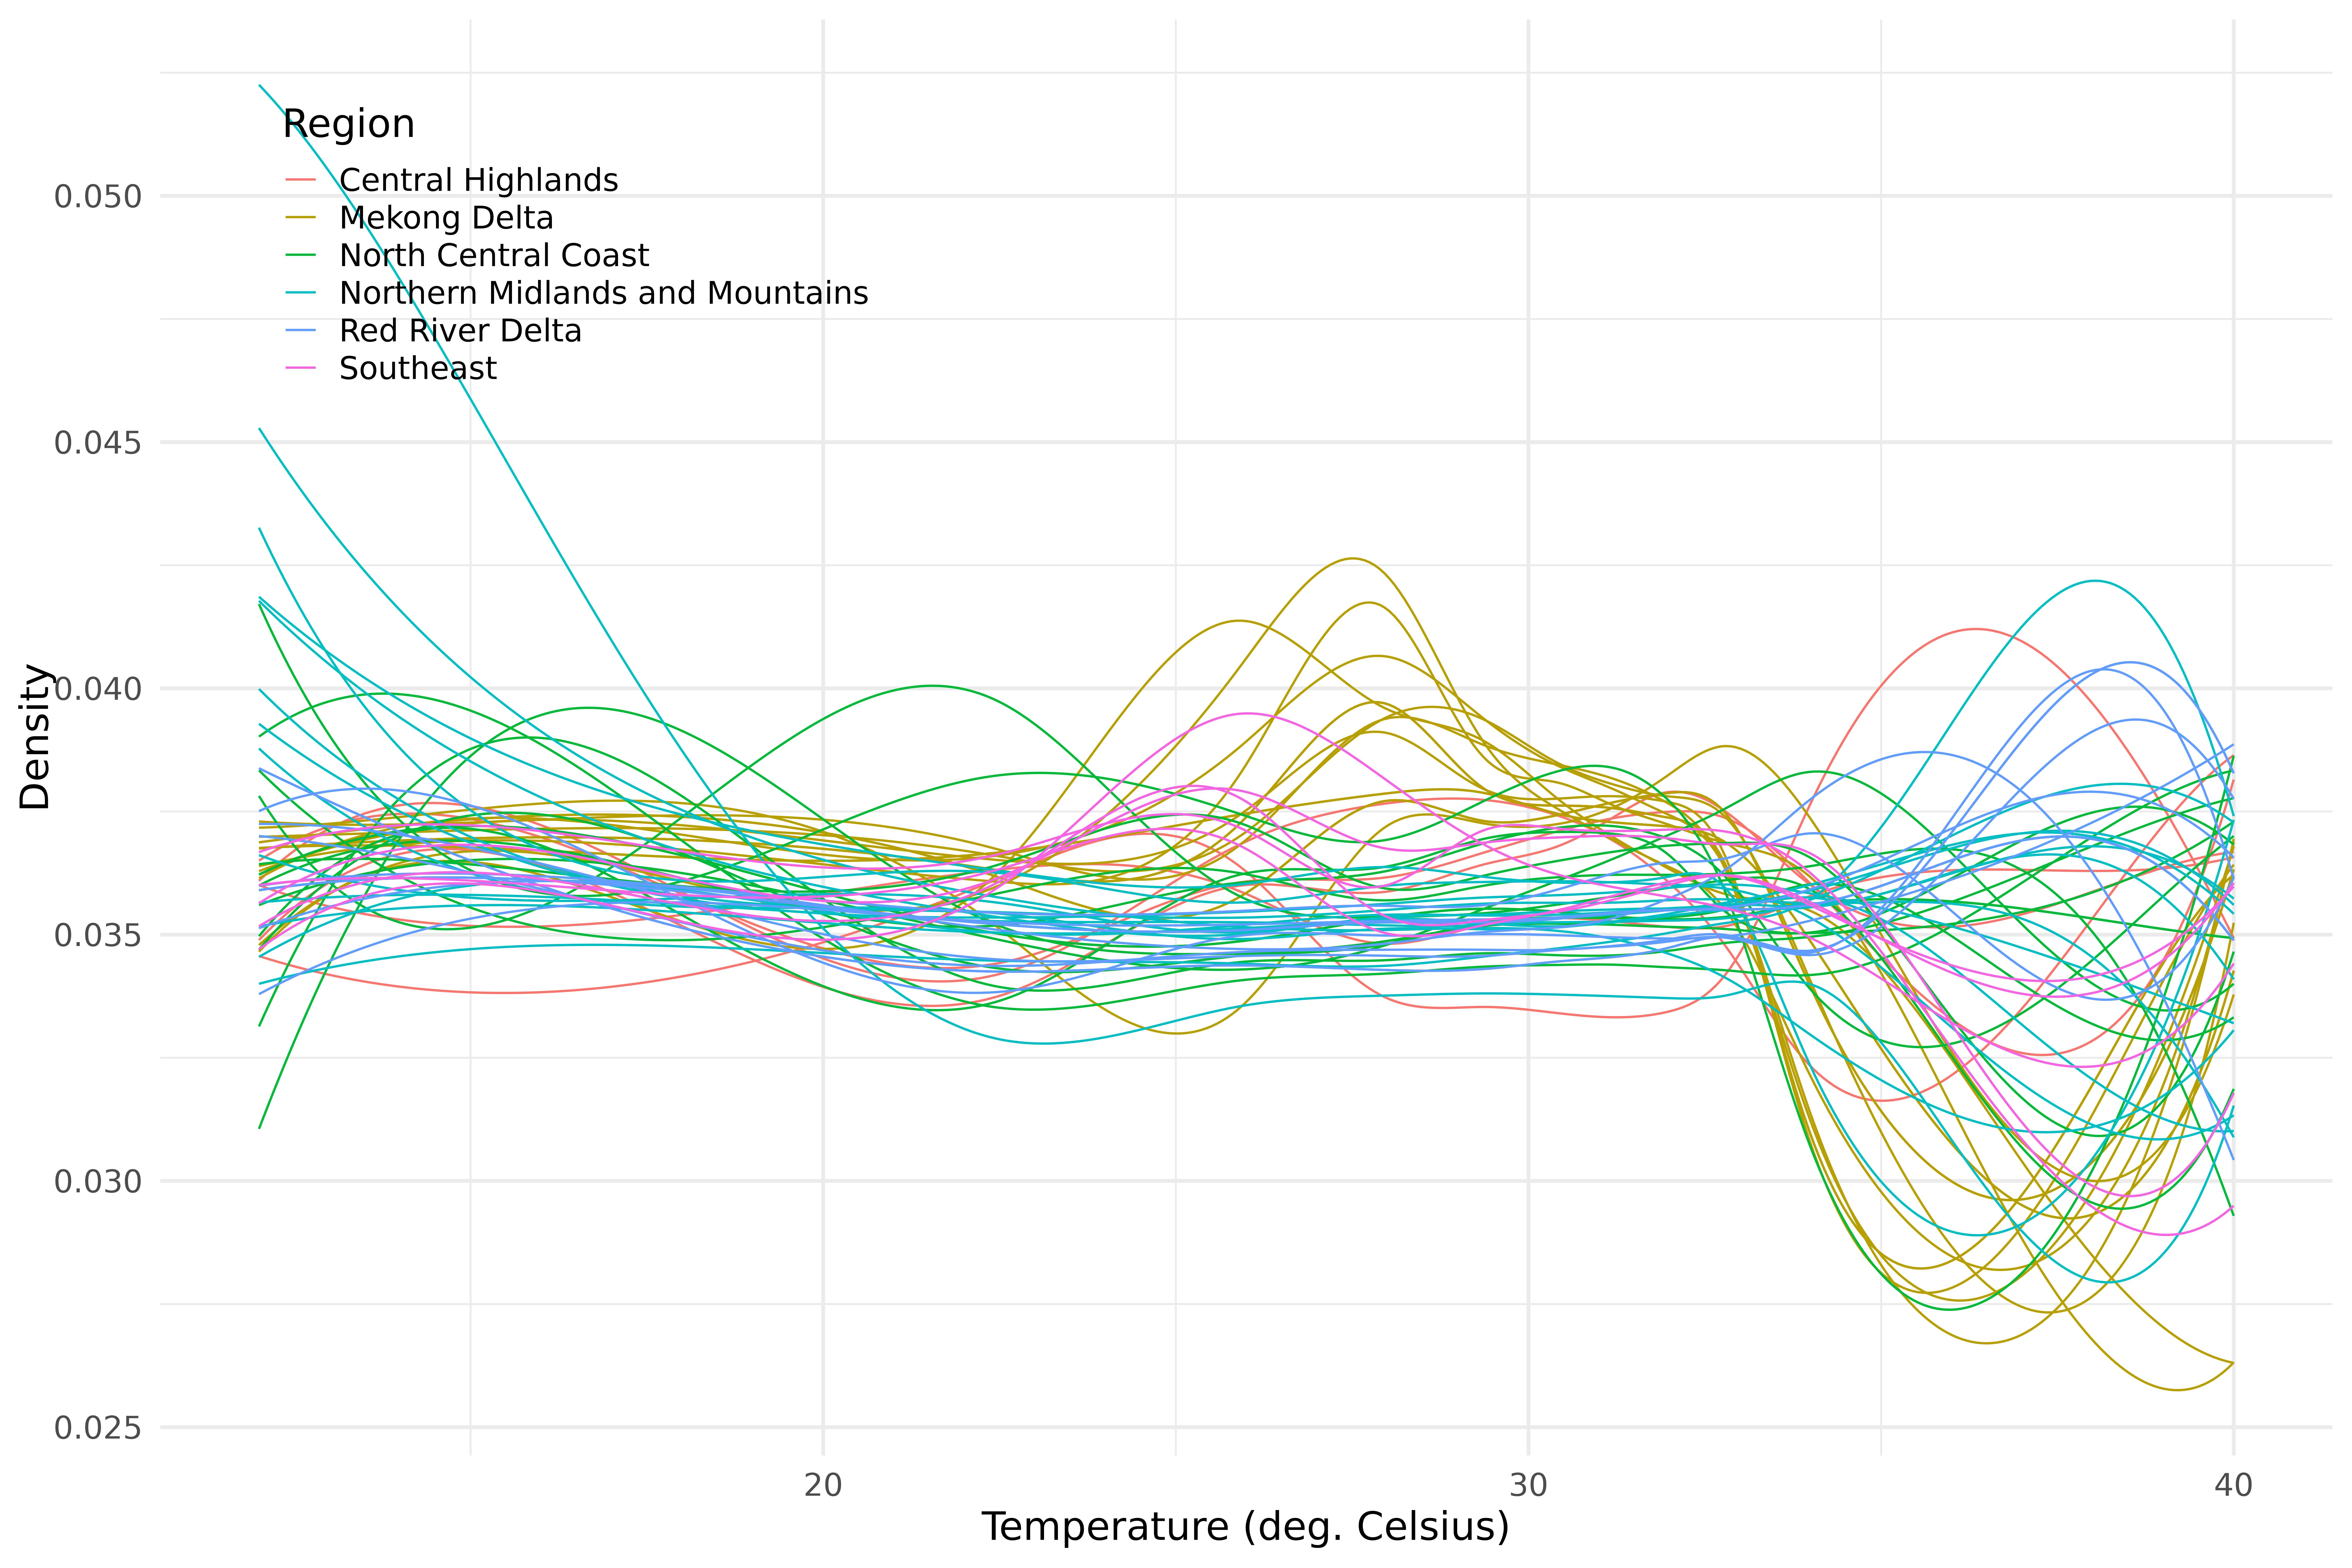
Density of maximum temperature per province.
vnt |>
  pull(t_max) |>
  mean() |>
  plot() +
  geom_hline(yintercept = 1 / diff(vnt$t_max[[1]]$basis$rangeval), color = "red", linetype = "dotted") +
  labs(
    x = "Temperature (deg. Celsius)",
    y = "Density"
  )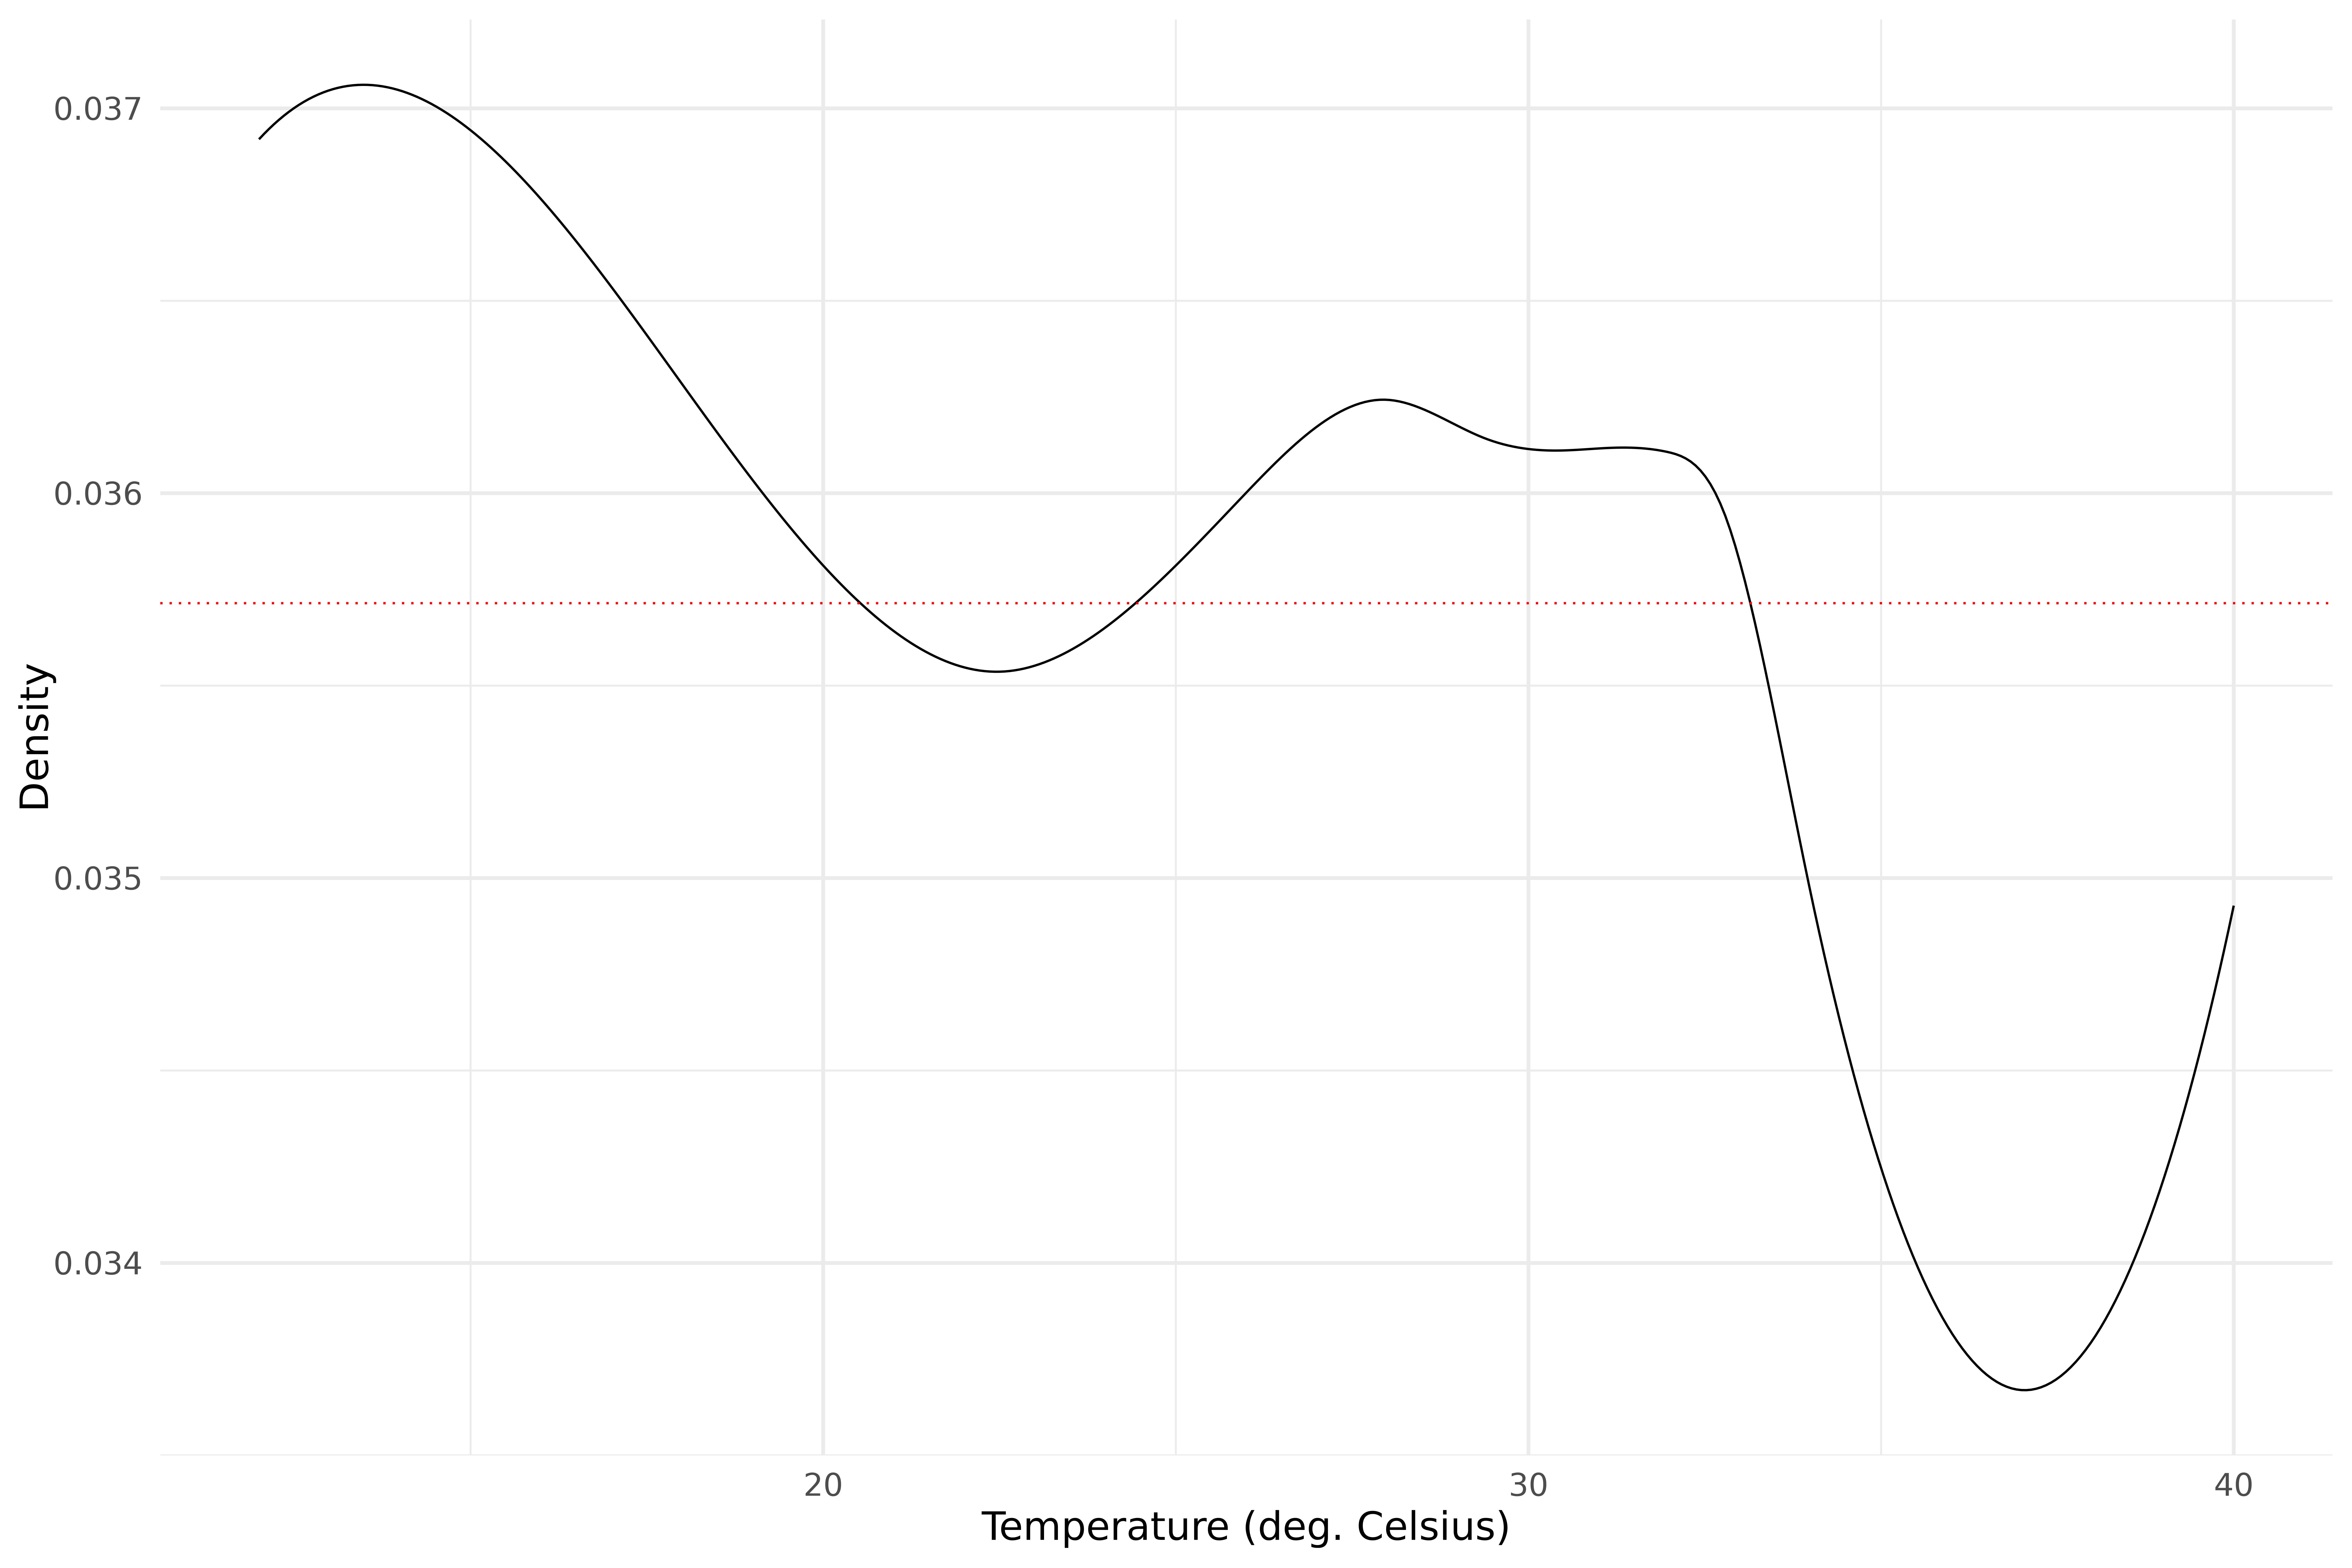
Mean annual trend of the maximum temperature distributions between 1987 and 2016.
vnt |>
  pull(t_max) |>
  mean() |>
  as.fd() |>
  plot() +
  labs(
    x = "Temperature (deg. Celsius)",
    y = "clr"
  )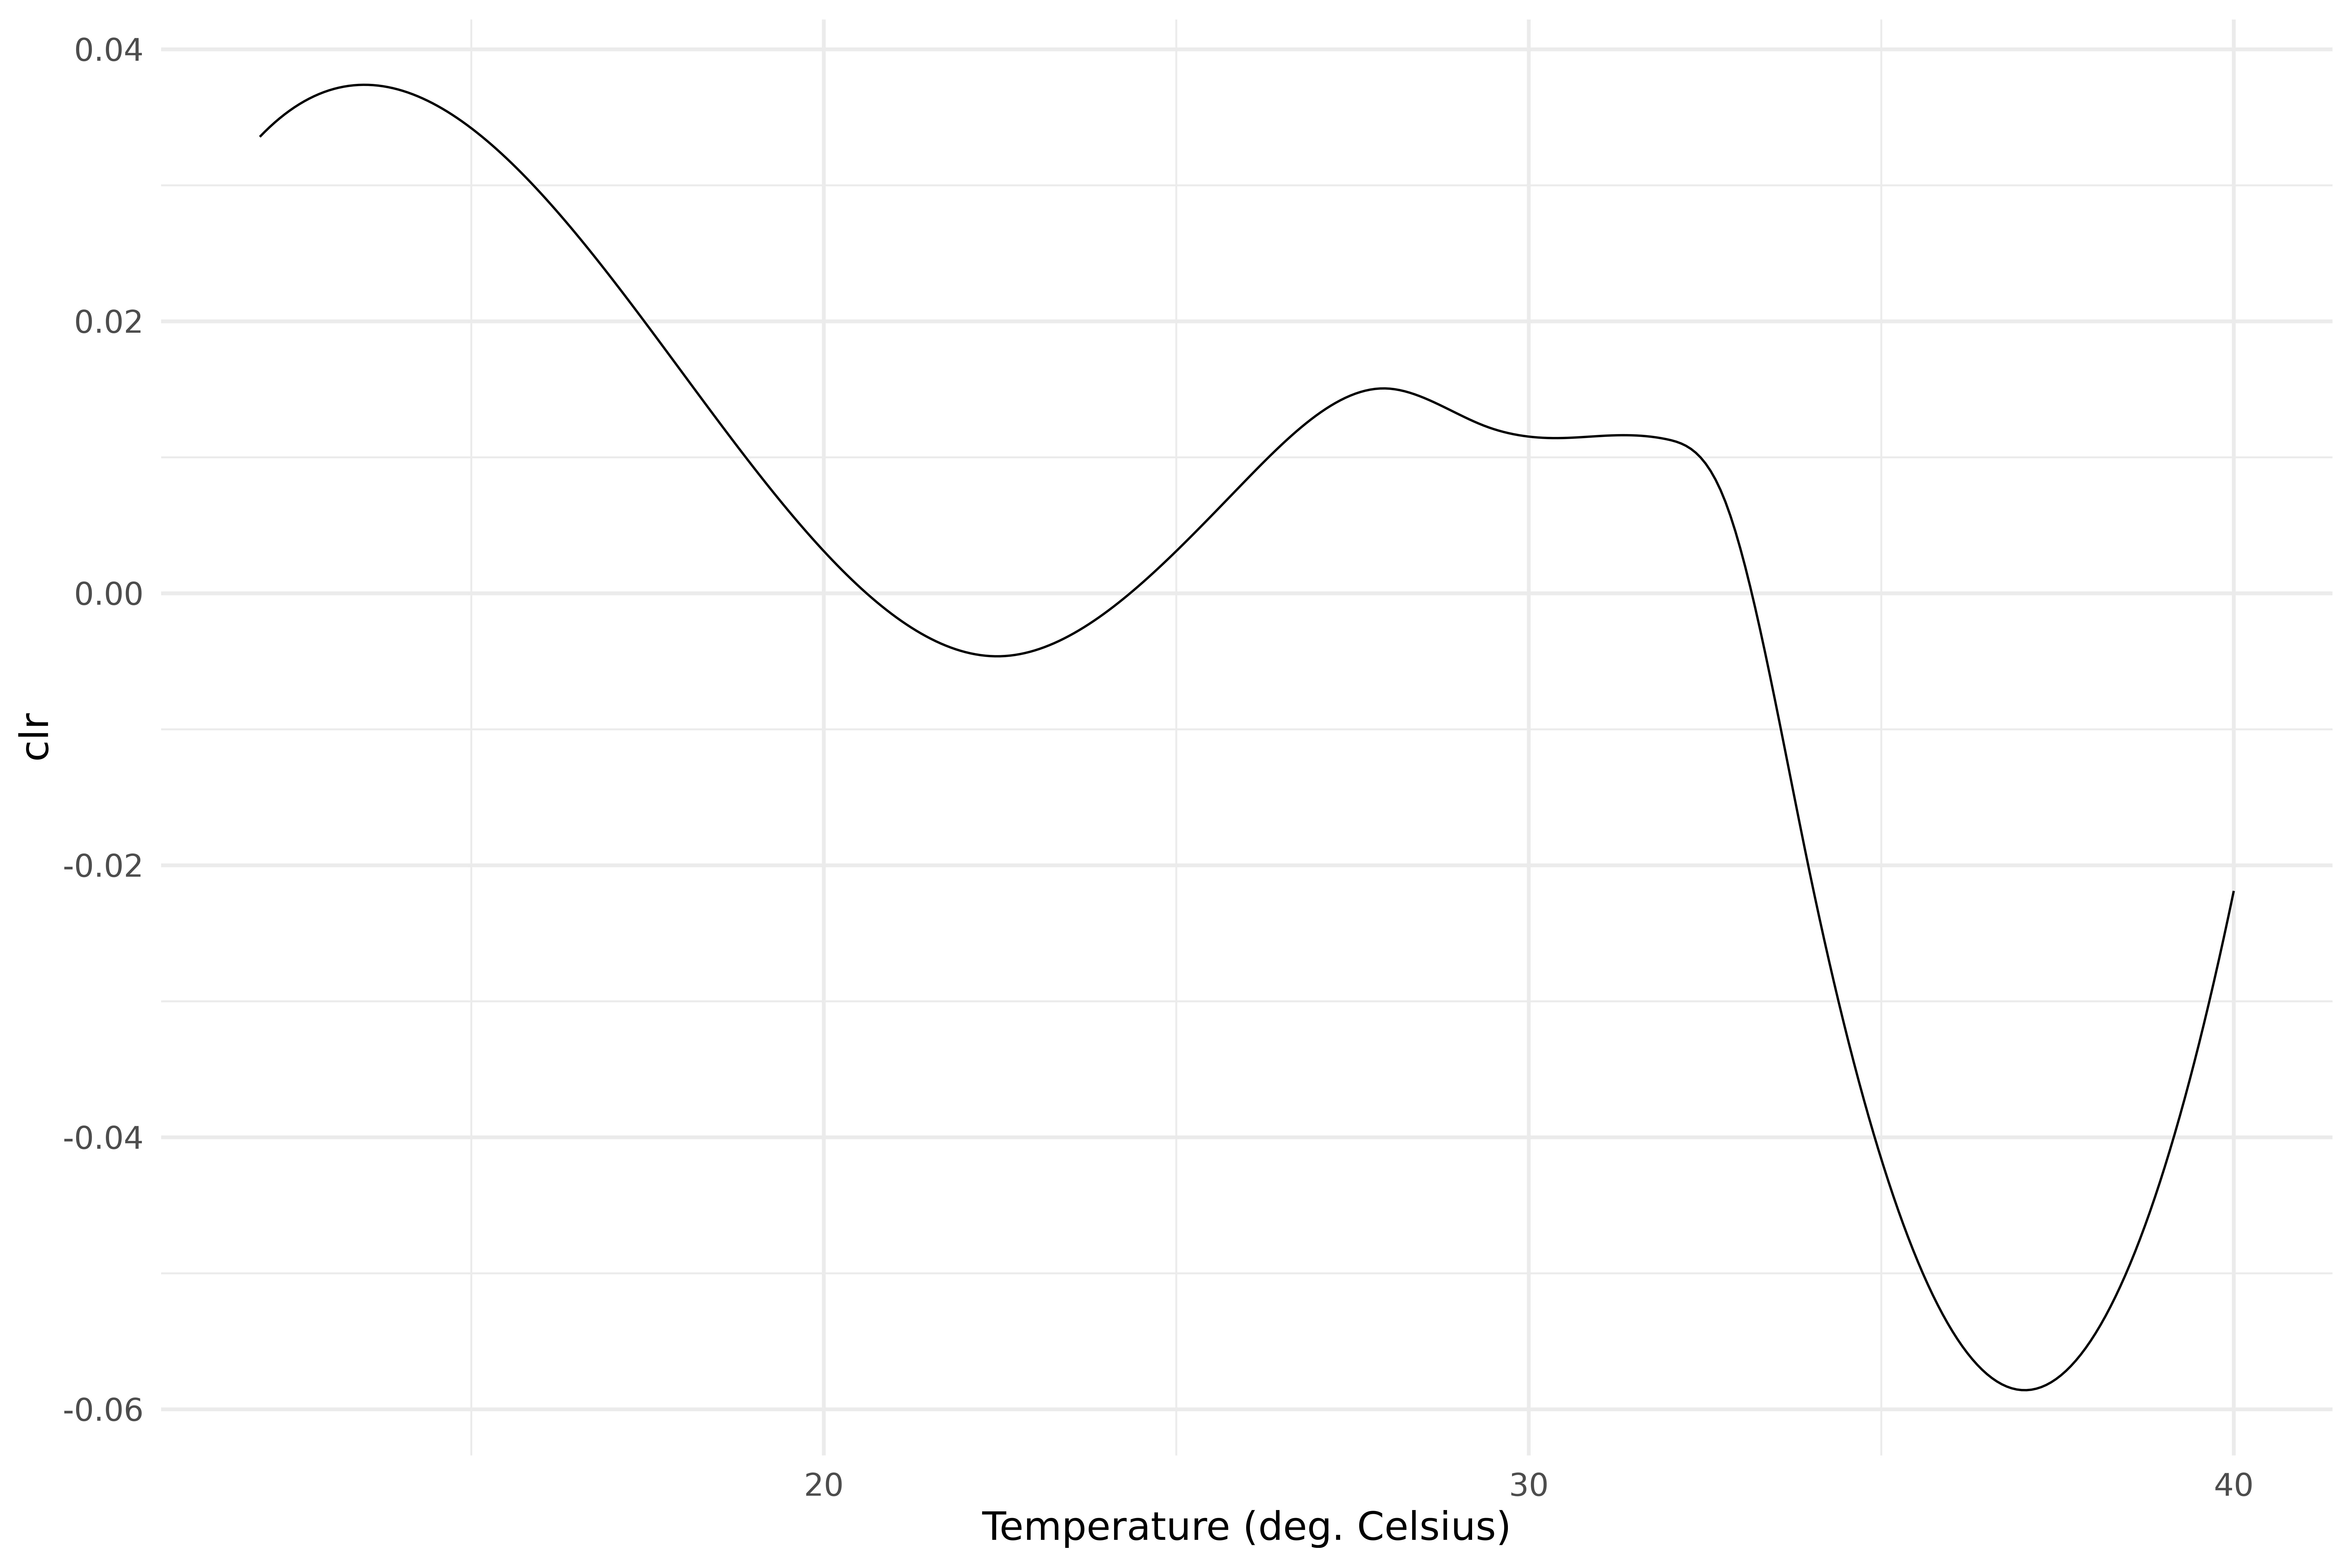
Centered log-ratio transform of the mean annual trend of maximum temperature distributions between 1987 and 2016.
Exploratory analysis by region
vietnam_provinces |>
  left_join(vietnam_regions, by = c("region" = "code")) |>
  rename(region_name = name) |>
  ggplot(aes(fill = region_name)) +
  geom_sf() +
  scale_x_continuous(breaks = seq(from = -180, to = 180, by = 2)) +
  labs(x = "Longitude", y = "Latitude", fill = "Region")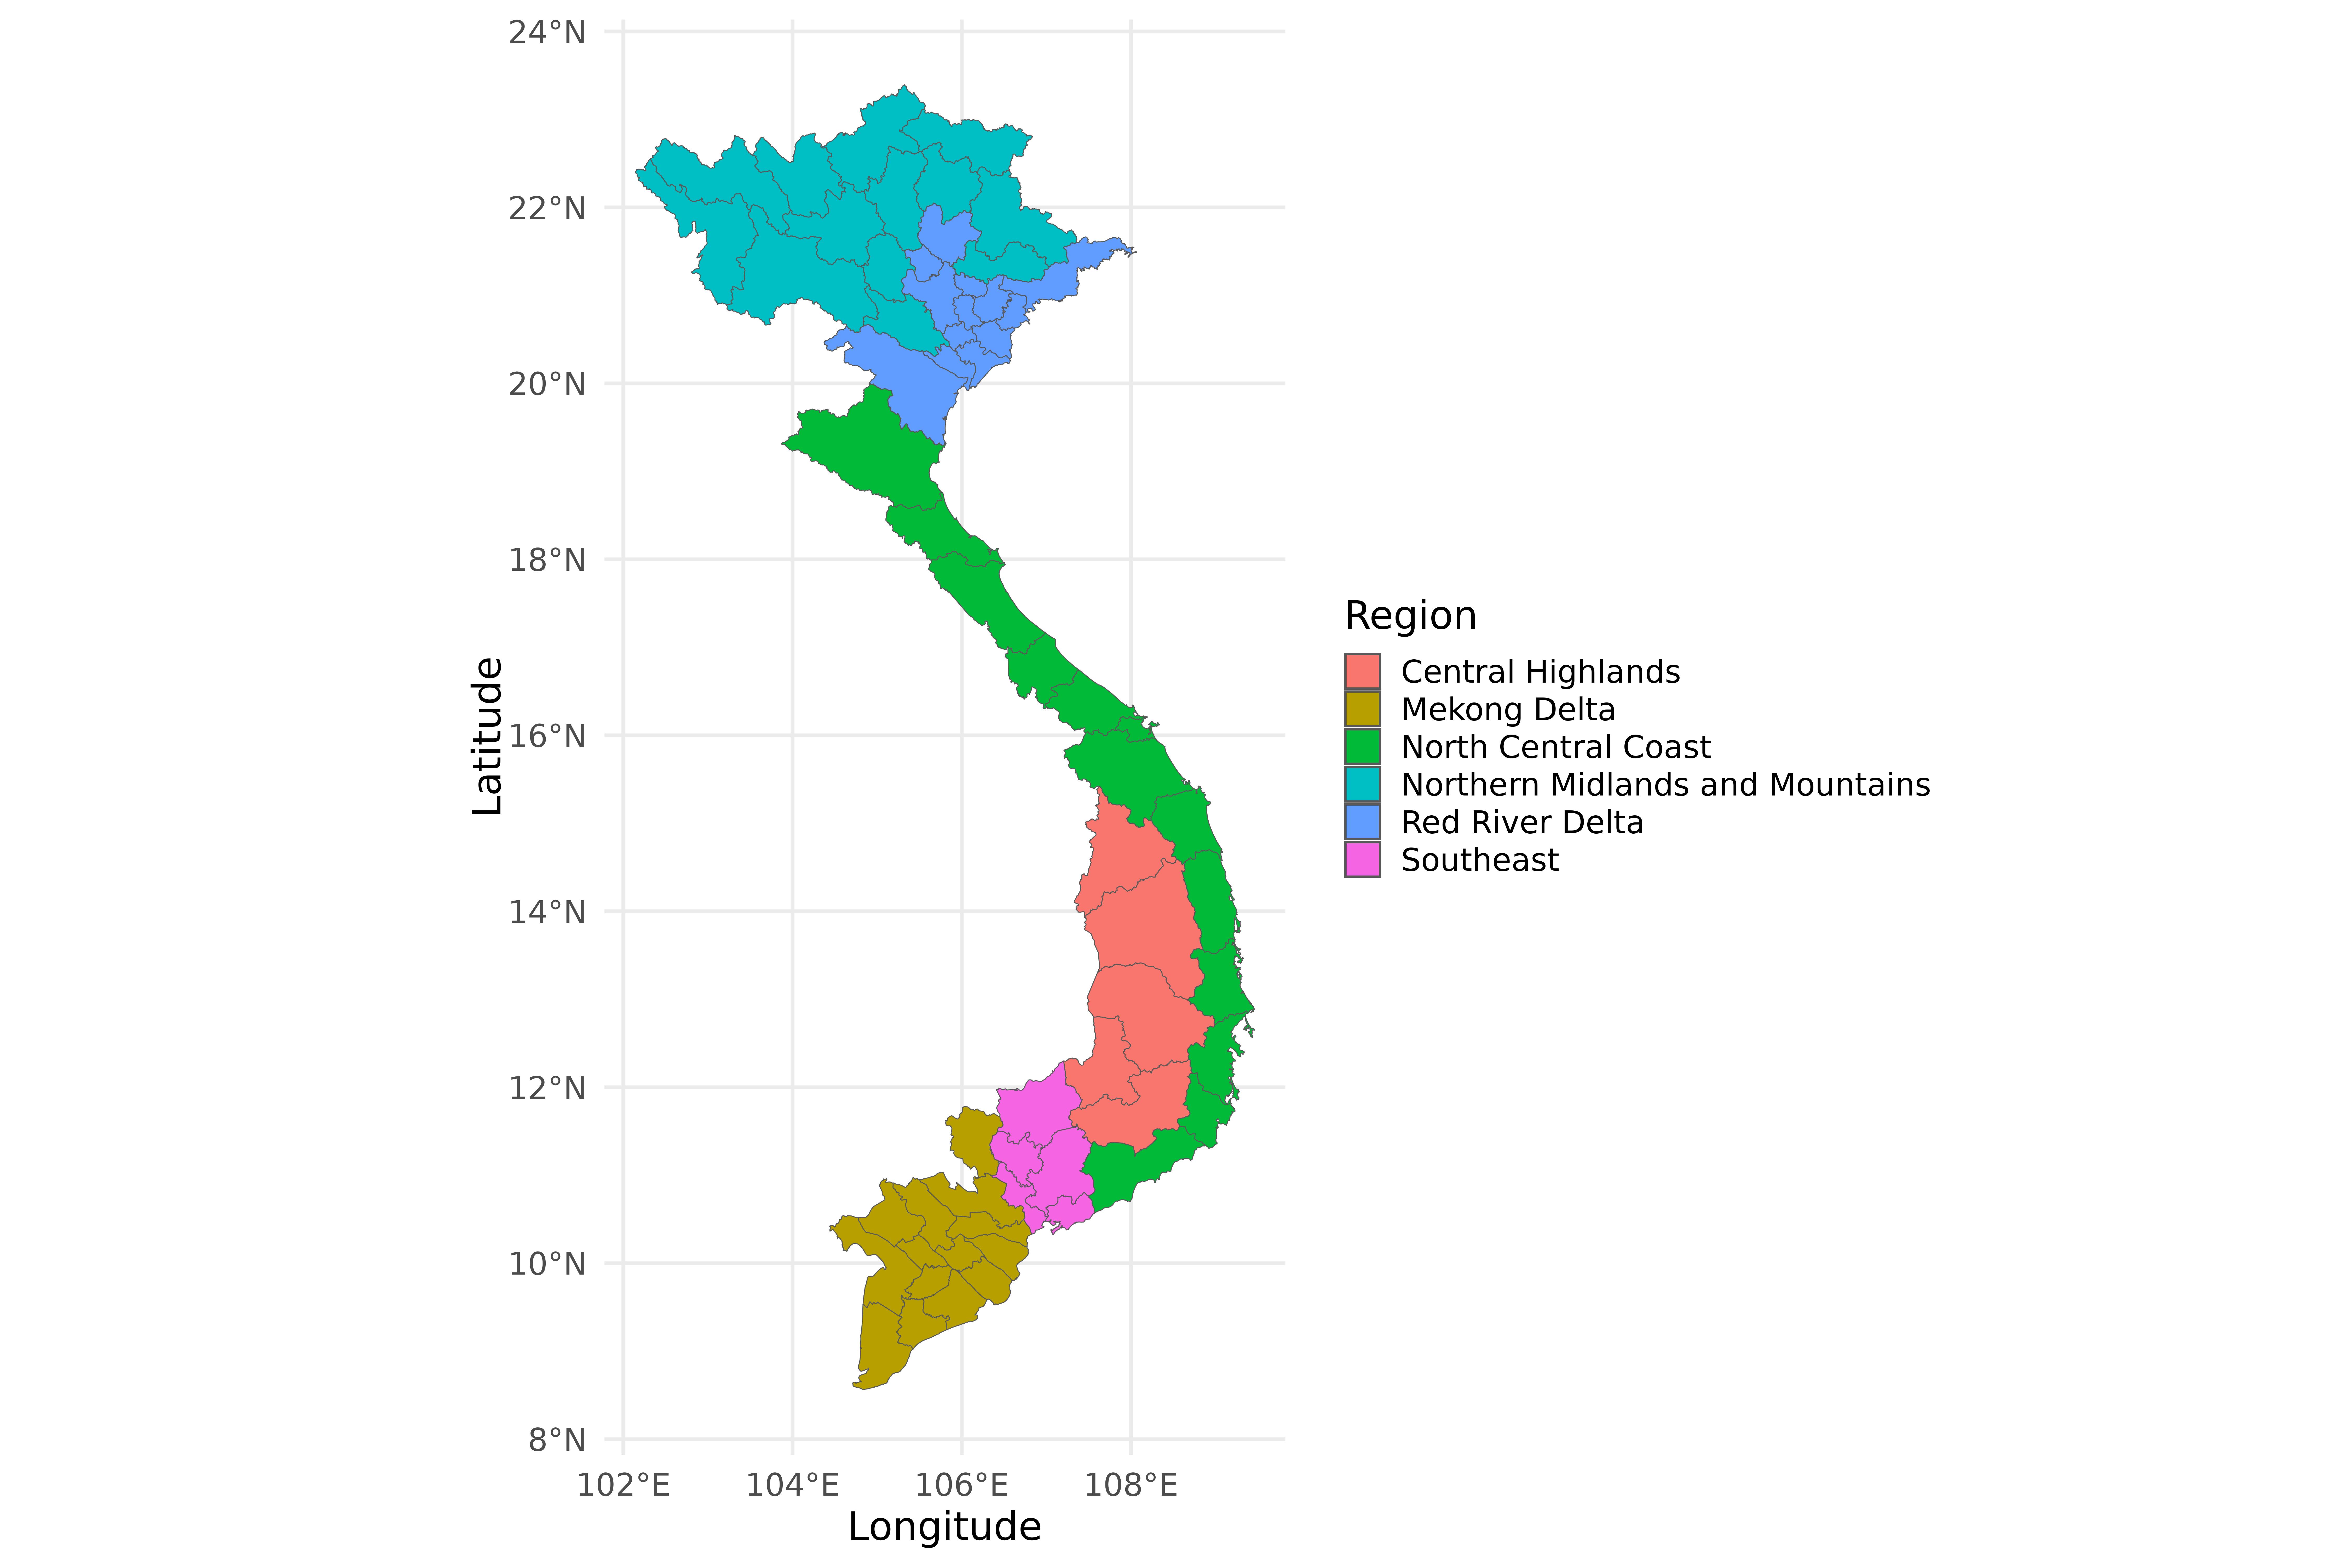
Map of Vietnam by region.
vntr <- vnt |>
  select(!province) |>
  group_by(region_name) |>
  summarise(t_max = mean(t_max))

vntr |> plot_funs(t_max, color = region_name) +
  geom_hline(yintercept = 1 / diff(vnt$t_max[[1]]$basis$rangeval), linetype = "dotted") +
  geom_function(fun = function(x) eval(mean(c(vnt$t_max)), x), color = "black", linetype = "dotted", linewidth = 1) +
  theme_legend_inside +
  labs(
    x = "Temperature (deg. Celsius)",
    y = "Density",
    color = "Region"
  )
#> Warning: Multiple drawing groups in `geom_function()`
#> i Did you use the correct group, colour, or fill aesthetics?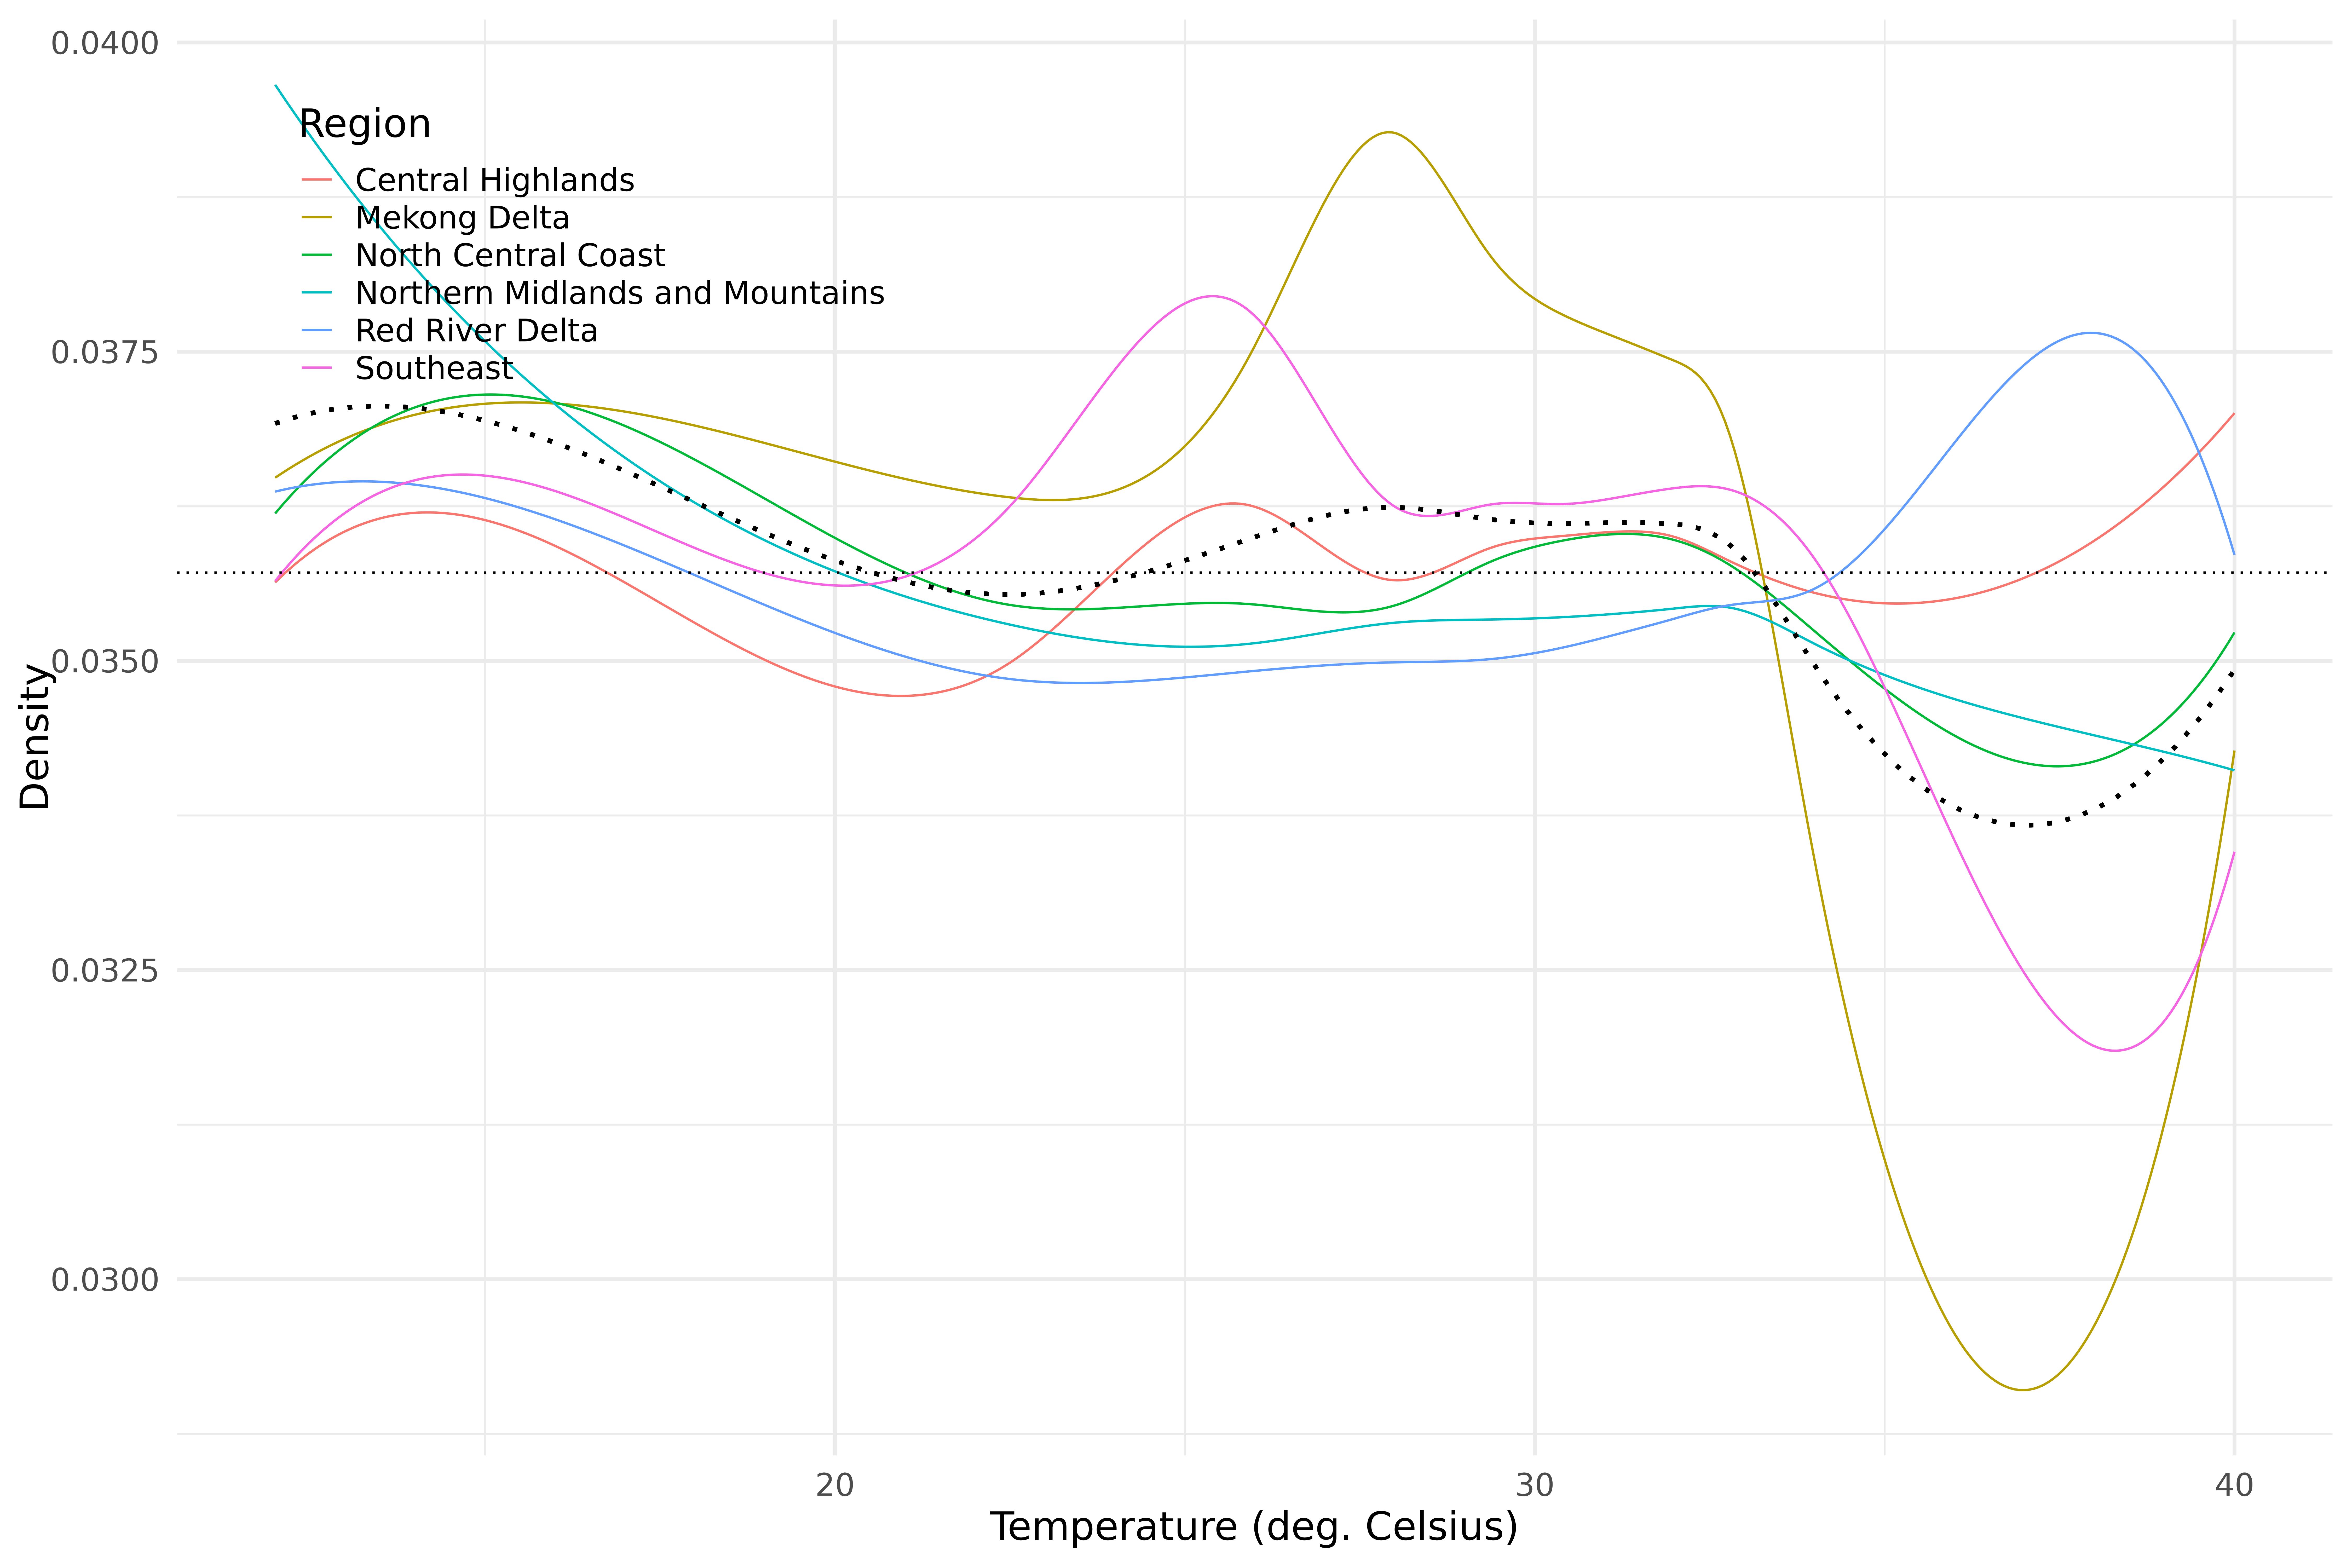
Mean trend density of maximum temperature per region.
vntry <- vietnam_temperature_dd |>
  left_join(vietnam_regions, by = c("region" = "code")) |>
  rename(region_name = name) |>
  arrange(region, province) |>
  select(!province) |>
  group_by(region_name, year) |>
  summarise(t_max = mean(t_max))
#> `summarise()` has grouped output by 'region_name'. You can override using the
#> `.groups` argument.

vntry |> plot_funs(t_max, color = region_name, linewidth = year, alpha = year) +
  facet_grid(vars(str_wrap(region_name, 14)), scales = "free_y") +
  scale_linewidth(range = c(0.2, 2)) +
  theme_legend_inside +
  labs(
    x = "Temperature (deg. Celsius)",
    y = "Density",
    color = "Region"
  )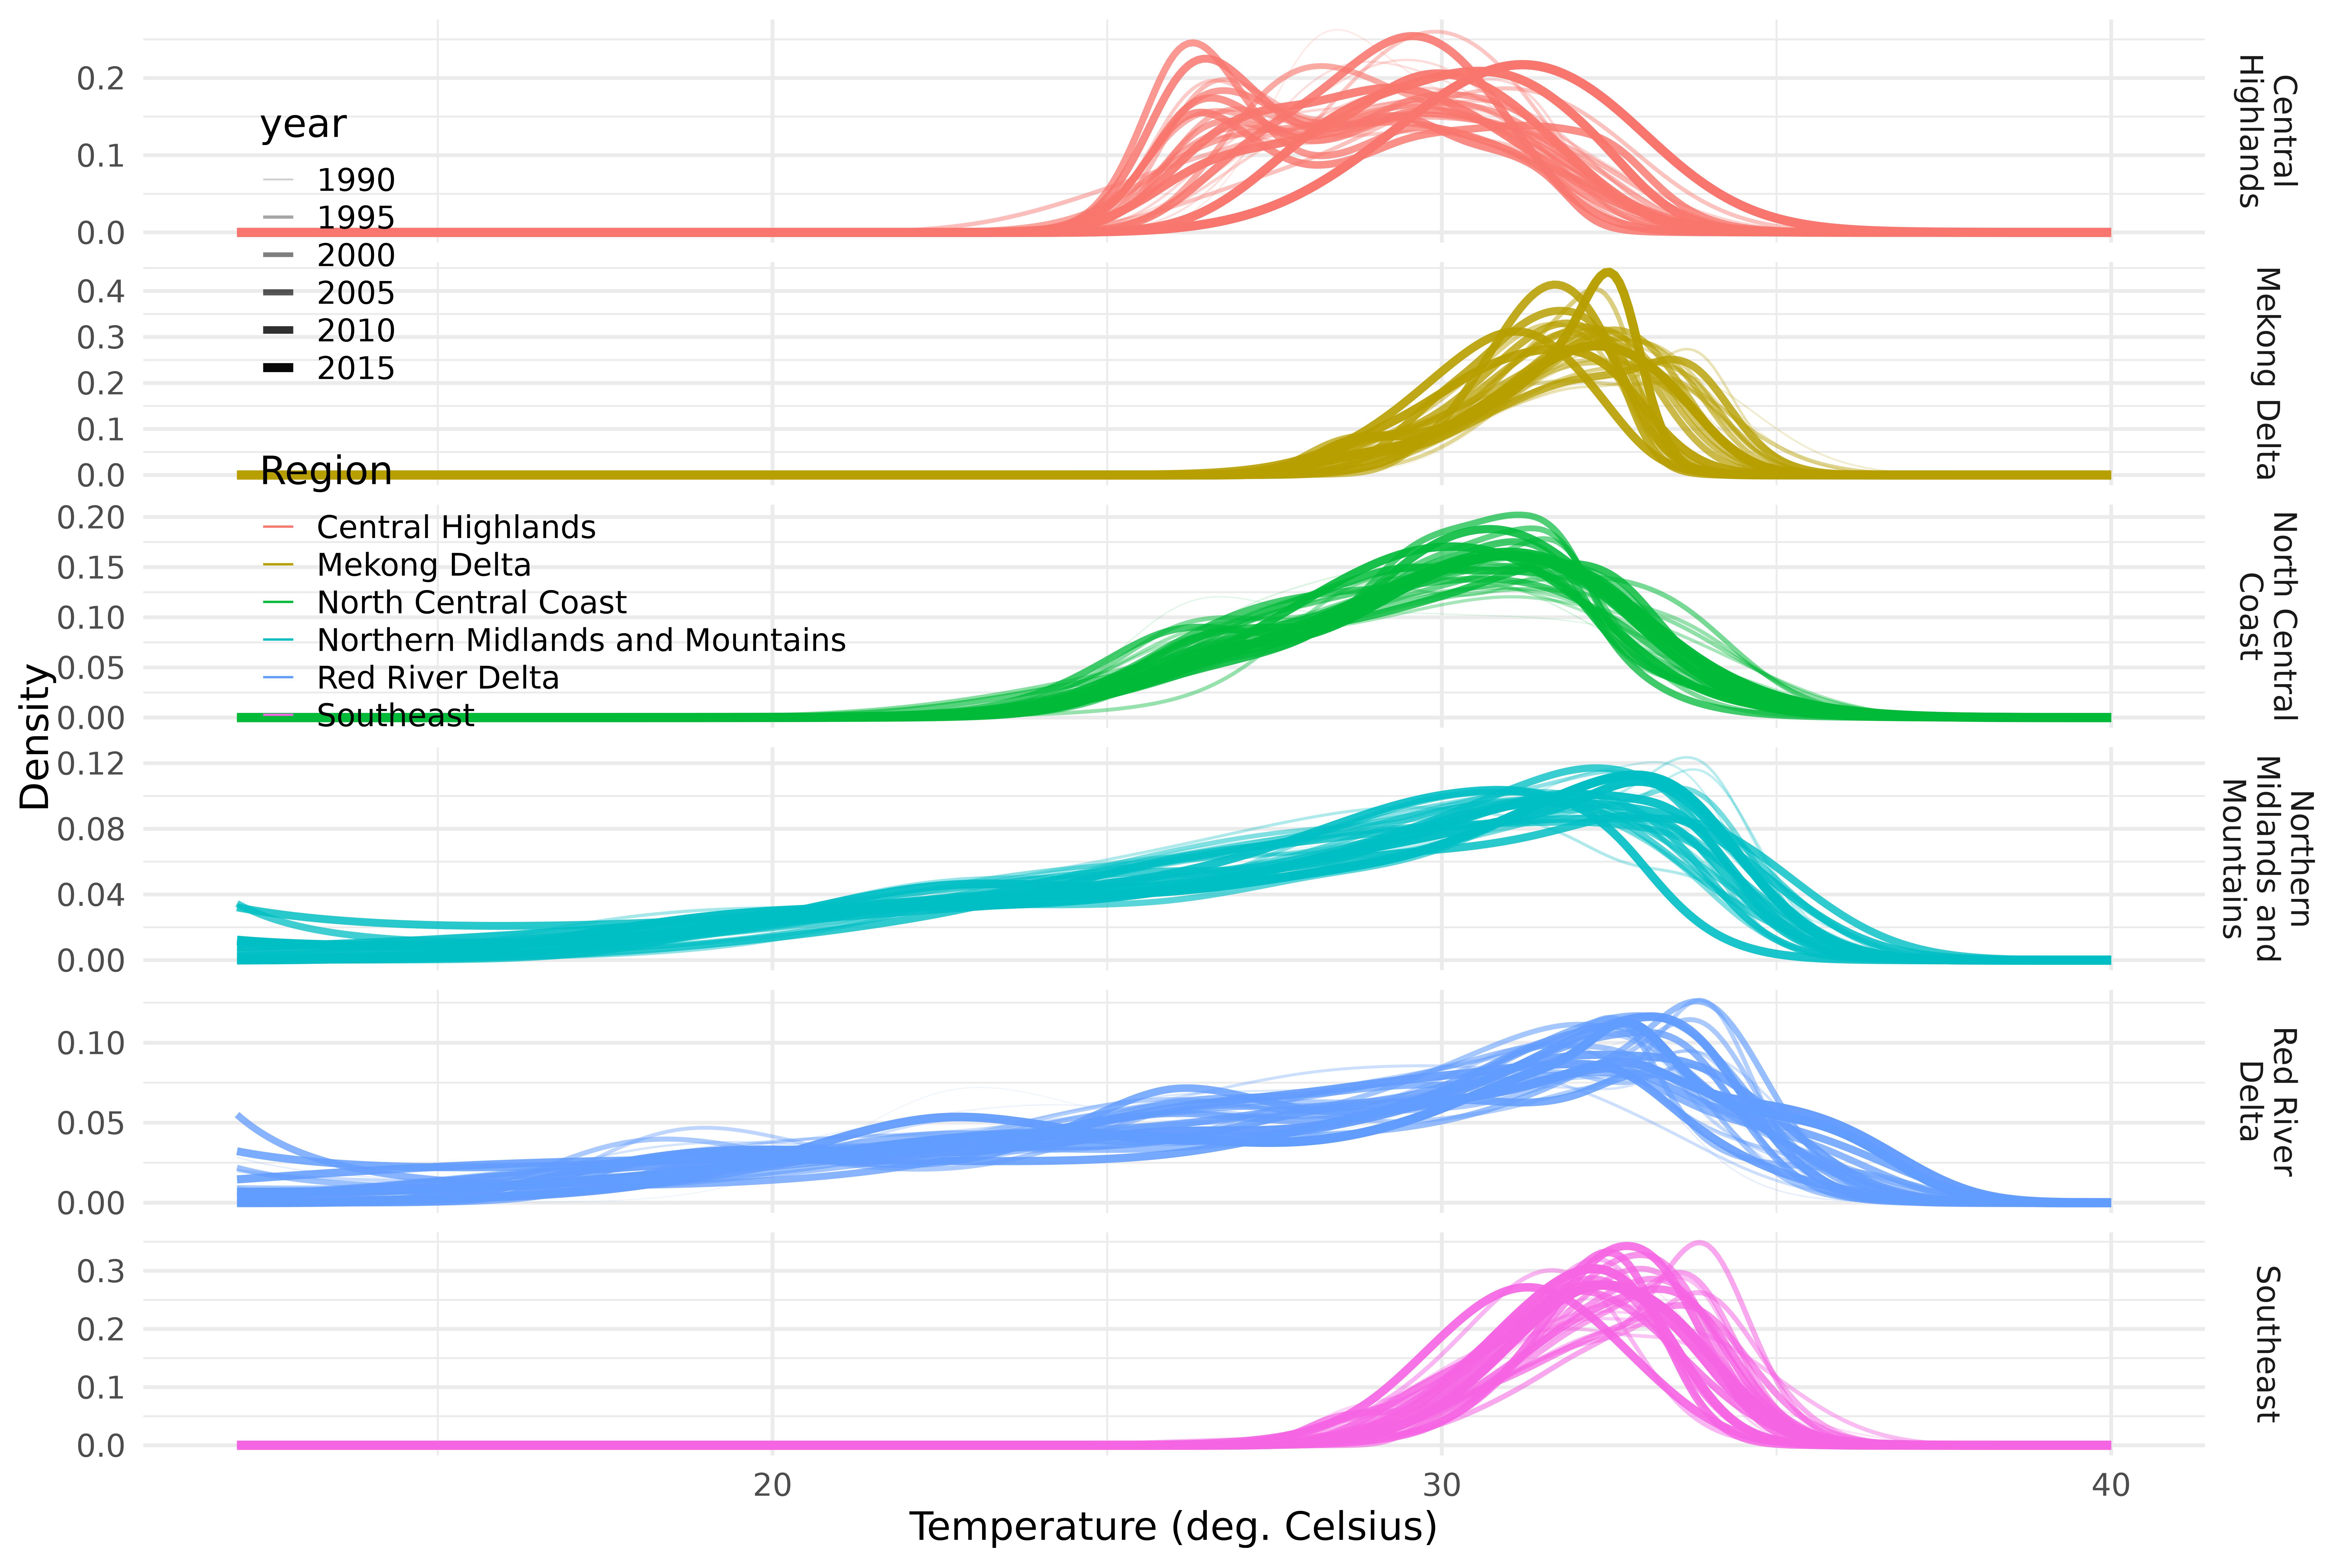
Mean trend density of maximum temperature per region.
Preliminary study
Normality assumption
mvn(vnt_pc$scores, mvnTest = "mardia")
#> $multivariateNormality
#>              Test        Statistic              p value Result
#> 1 Mardia Skewness 236.796233340498 8.36360275201567e-32     NO
#> 2 Mardia Kurtosis 11.0447074304137                    0     NO
#> 3             MVN             <NA>                 <NA>     NO
#>
#> $univariateNormality
#>               Test  Variable Statistic   p value Normality
#> 1 Anderson-Darling  Column1     1.4247   0.001      NO
#> 2 Anderson-Darling  Column2     3.5984  <0.001      NO
#> 3 Anderson-Darling  Column3     0.2838  0.6209      YES
#> 4 Anderson-Darling  Column4     1.1746  0.0042      NO
#> 5 Anderson-Darling  Column5     1.3594  0.0015      NO
#>
#> $Descriptives
#>    n          Mean    Std.Dev       Median        Min       Max        25th
#> 1 63 -3.271752e-18 0.23634837  0.054066924 -0.4658859 0.4379686 -0.22698516
#> 2 63 -3.940975e-18 0.11303792  0.021633456 -0.6304448 0.1611768 -0.03712273
#> 3 63  2.979835e-18 0.10885494 -0.005430535 -0.2651669 0.2007059 -0.06621715
#> 4 63  4.553004e-19 0.05495679  0.002209999 -0.1616571 0.1619070 -0.03196695
#> 5 63 -2.204746e-18 0.05252636 -0.003134425 -0.1954665 0.1080602 -0.01736823
#>         75th       Skew   Kurtosis
#> 1 0.18922297 -0.2551881 -1.1623638
#> 2 0.05474903 -2.9836297 13.4528218
#> 3 0.07126844 -0.1405793 -0.3803929
#> 4 0.01976211  0.3854705  1.6145156
#> 5 0.02425947 -0.8676932  2.5030284
Homogeneity of variances
vnt_var <- var.fd(c(as.fd(vnt$t_max)))

tt <- seq(
  vnt_var$sbasis$rangeval[1],
  vnt_var$sbasis$rangeval[2],
  length.out = 401
)

z <- eval.bifd(tt, tt, vnt_var) # Covariance
z <- cor.fd(tt, c(as.fd(vnt$t_max))) # Correlation

df <- data.frame(
  x = rep(tt, each = length(tt)),
  y = rep(tt, times = length(tt)),
  z = as.vector(z)
)

ggplot(df, aes(x = x, y = y, z = z)) +
  geom_contour_filled() +
  labs(
    fill = "Correlation",
    x = "Temperature (deg. Celsius)", y = "Temperature (deg. Celsius)"
  )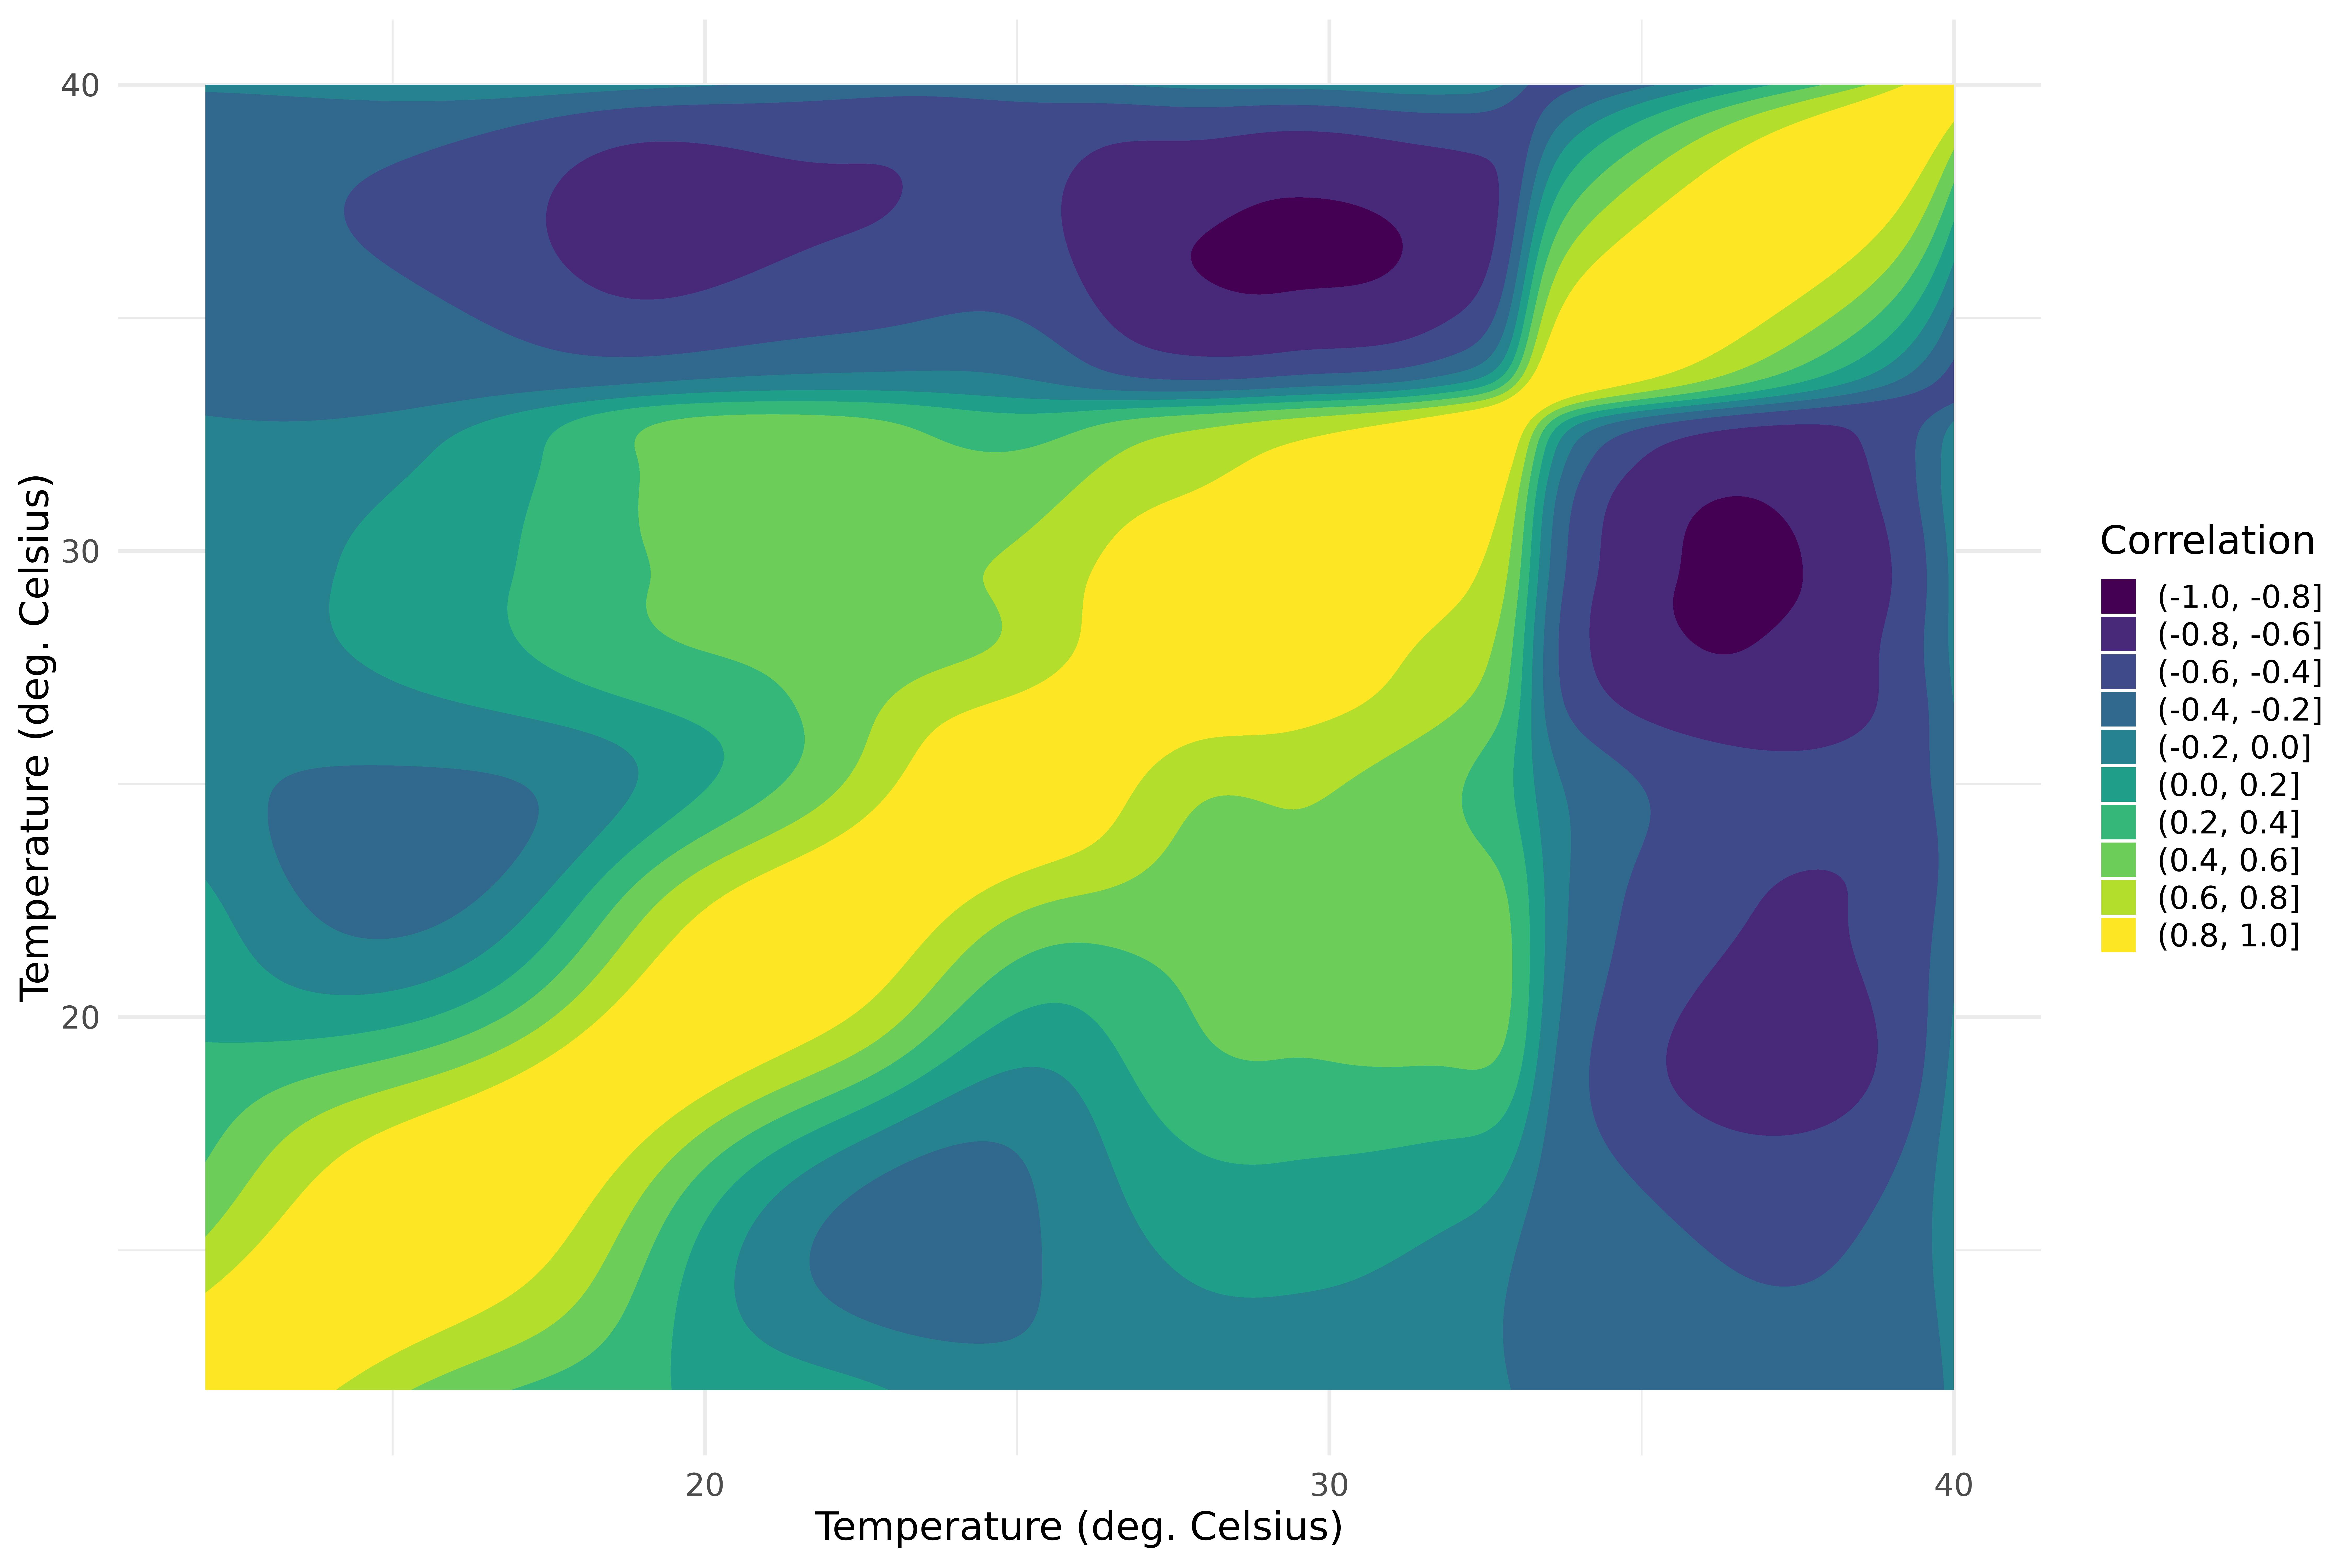
Correlation function within the MDR region.
Global tests
Distributional ANOVA
vnte <- vnt |>
  mutate(t_max = as.fd(t_max)) |>
  eval_funs(t_max, n = 1401) |>
  select(province, x, y) |>
  pivot_wider(names_from = province, values_from = y) |>
  column_to_rownames("x")

vnt_province_region <- vietnam_provinces$region
names(vnt_province_region) <- vietnam_provinces$province

plotFANOVA(vnte, vnt_province_region[colnames(vnte)], separately = TRUE)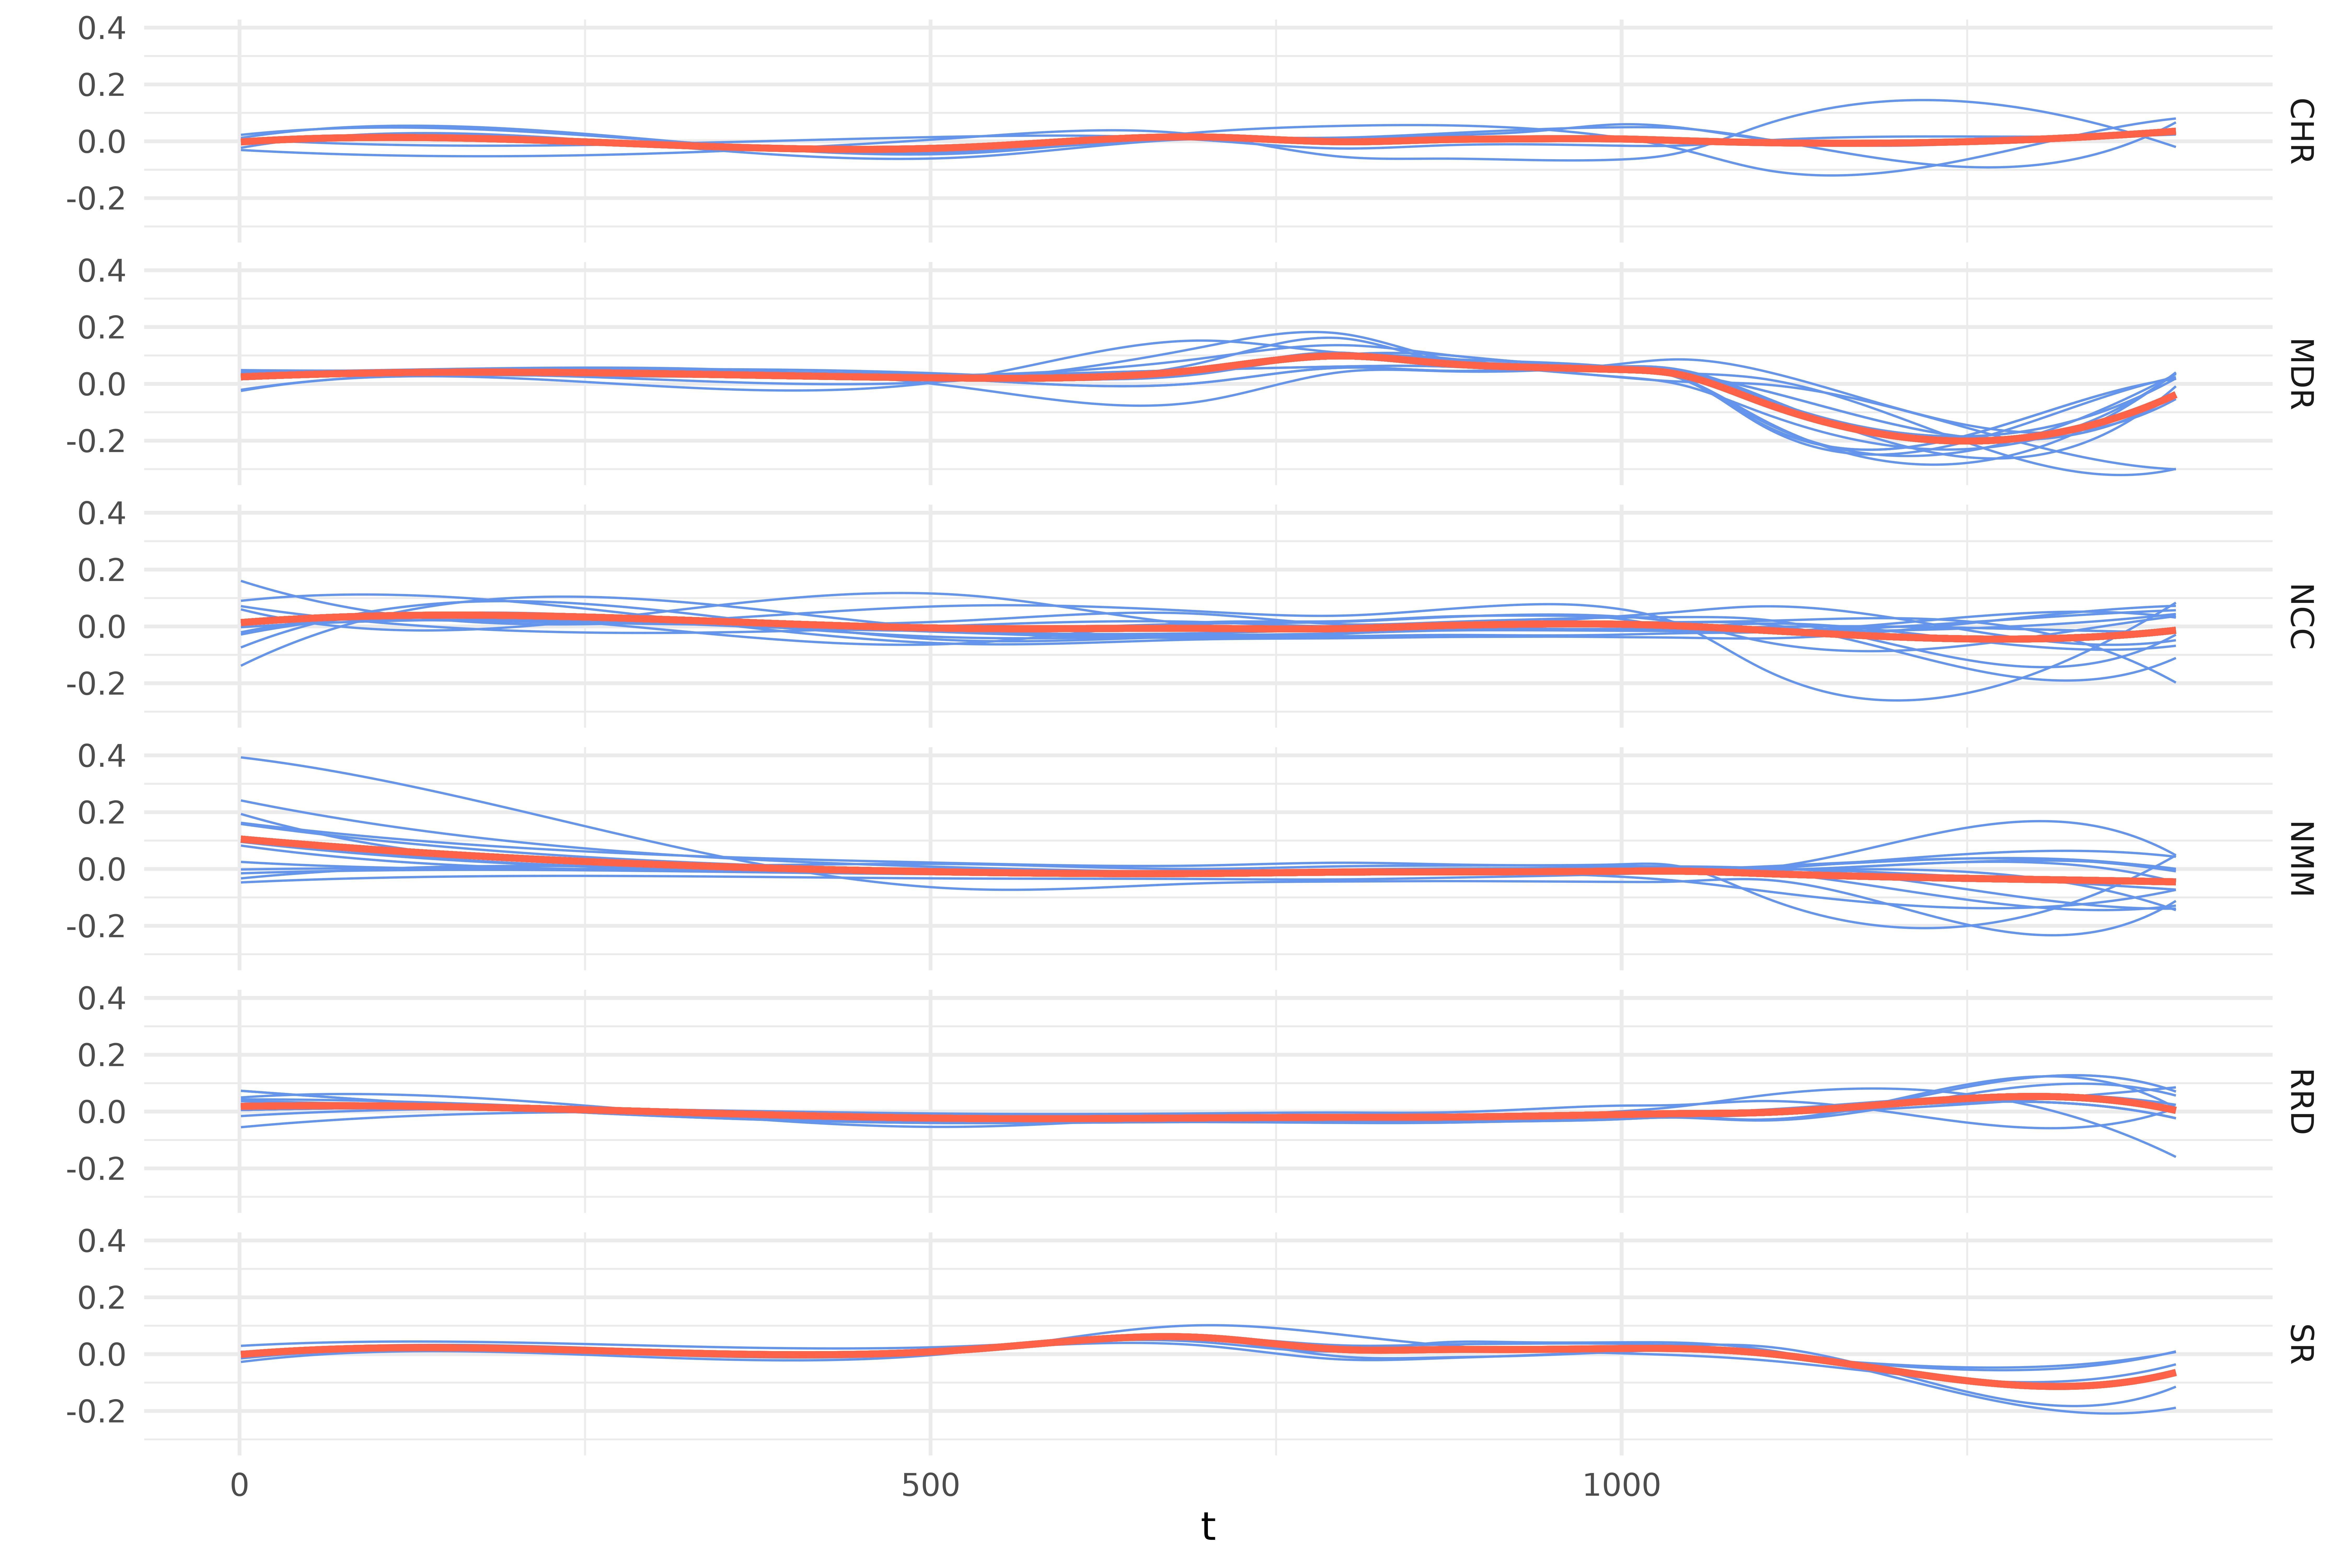
stat_list <- list("GPF", "Fmaxb", "CS", "L2B", "FB")

res <- fanova.tests(vnte, vnt_province_region[colnames(vnte)],
  test = stat_list,
  params = list(
    paramCS = 100,
    paramFmaxb = 100,
    paramTRP = list(B.TRP = 100)
  )
)

res_tbl <- res[as_vector(stat_list)] |>
  sapply(function(x) c(`Statistic` = x$stat, `p-value` = x$pval)) |>
  t() |>
  as.data.frame() |>
  rownames_to_column("Name") |>
  kable_format()

res_tbl
#>    Name Statistic   p-value
#> 1   GPF       10  0e+00 ***
#> 2 Fmaxb       36  0e+00 ***
#> 3    CS      740  0e+00 ***
#> 4   L2B      130  0e+00 ***
#> 5    FB      9.9  0e+00 ***
#> ```tex
#> \begin{table}
#> \centering
#> \begin{tabular}[t]{lll}
#> \toprule
#> Name & Statistic & p-value\\
#> \midrule
#> \cellcolor{gray!10}{GPF} & \cellcolor{gray!10}{10} & \cellcolor{gray!10}{0e+00 ***}\\
#> Fmaxb & 36 & 0e+00 ***\\
#> \cellcolor{gray!10}{CS} & \cellcolor{gray!10}{740} & \cellcolor{gray!10}{0e+00 ***}\\
#> L2B & 130 & 0e+00 ***\\
#> \cellcolor{gray!10}{FB} & \cellcolor{gray!10}{9.9} & \cellcolor{gray!10}{0e+00 ***}\\
#> \bottomrule
#> \end{tabular}
#> \end{table}
#> ```Pairwise comparisons
vntp <- t(combn(c("NMM", "RRD", "NCC", "CHR", "SR", "MDR"), m = 2))
colnames(vntp) <- c("region1", "region2")

pairwise_anova <- function(region1, region2) {
  data <- vnte[vnt_province_region[colnames(vnte)] %in% c(region1, region2)]

  res <- fanova.tests(data, vnt_province_region[colnames(data)],
    test = stat_list,
    params = list(
      paramCS = 100,
      paramFmaxb = 100,
      paramTRP = list(B.TRP = 100)
    )
  )

  res[as_vector(stat_list)] |>
    sapply(function(x) c(x$pval)) |> c()
}

res_tbl <- as_tibble(vntp) |>
  rowwise() |>
  mutate(res = map2(region1, region2, pairwise_anova)) |>
  unnest_wider(res) |>
  kable_format()

res_tbl
#> # A tibble: 15 x 7
#>    region1 region2 GPF           Fmaxb       CS          L2B           FB
#>    <chr>   <chr>   <chr>         <chr>       <chr>       <chr>         <chr>
#>  1 NMM     RRD     "2.6e-02 **"  "0.12 "     "0e+00 ***" "7e-03 ***"   "1.3e-02~
#>  2 NMM     NCC     "0.53 "       "0.33 "     "0.45 "     "0.44 "       "0.46 "
#>  3 NMM     CHR     "4.2e-02 **"  "2e-02 **"  "0.17 "     "0.21 "       "0.25 "
#>  4 NMM     SR      "2e-06 ***"   "0e+00 ***" "2e-02 **"  "8e-02 *"     "0.11 "
#>  5 NMM     MDR     "0e+00 ***"   "0e+00 ***" "0e+00 ***" "3.6e-10 ***" "9.2e-08~
#>  6 RRD     NCC     "1.9e-03 ***" "1e-02 ***" "0e+00 ***" "1.7e-04 ***" "5.8e-04~
#>  7 RRD     CHR     "2.2e-03 ***" "0e+00 ***" "0.23 "     "0.11 "       "0.14 "
#>  8 RRD     SR      "0e+00 ***"   "0e+00 ***" "0e+00 ***" "5.8e-12 ***" "2.6e-07~
#>  9 RRD     MDR     "0e+00 ***"   "0e+00 ***" "0e+00 ***" "0e+00 ***"   "0e+00 *~
#> 10 NCC     CHR     "0.24 "       "0.17 "     "0.24 "     "0.29 "       "0.32 "
#> 11 NCC     SR      "4.3e-02 **"  "1e-02 ***" "1e-02 ***" "5.9e-02 *"   "8e-02 *"
#> 12 NCC     MDR     "1.3e-14 ***" "0e+00 ***" "0e+00 ***" "5.3e-14 ***" "1.8e-10~
#> 13 CHR     SR      "2.1e-02 **"  "5e-02 **"  "4e-02 **"  "1.1e-02 **"  "3.4e-02~
#> 14 CHR     MDR     "3.2e-12 ***" "0e+00 ***" "0e+00 ***" "2.4e-12 ***" "1.5e-08~
#> 15 SR      MDR     "1.8e-07 ***" "0e+00 ***" "0e+00 ***" "6e-05 ***"   "4.1e-04~
#> ```tex
#> \begin{table}
#> \centering
#> \begin{tabular}[t]{lllllll}
#> \toprule
#> region1 & region2 & GPF & Fmaxb & CS & L2B & FB\\
#> \midrule
#> \cellcolor{gray!10}{NMM} & \cellcolor{gray!10}{RRD} & \cellcolor{gray!10}{2.6e-02 **} & \cellcolor{gray!10}{0.12} & \cellcolor{gray!10}{0e+00 ***} & \cellcolor{gray!10}{7e-03 ***} & \cellcolor{gray!10}{1.3e-02 **}\\
#> NMM & NCC & 0.53 & 0.33 & 0.45 & 0.44 & 0.46\\
#> \cellcolor{gray!10}{NMM} & \cellcolor{gray!10}{CHR} & \cellcolor{gray!10}{4.2e-02 **} & \cellcolor{gray!10}{2e-02 **} & \cellcolor{gray!10}{0.17} & \cellcolor{gray!10}{0.21} & \cellcolor{gray!10}{0.25}\\
#> NMM & SR & 2e-06 *** & 0e+00 *** & 2e-02 ** & 8e-02 * & 0.11\\
#> \cellcolor{gray!10}{NMM} & \cellcolor{gray!10}{MDR} & \cellcolor{gray!10}{0e+00 ***} & \cellcolor{gray!10}{0e+00 ***} & \cellcolor{gray!10}{0e+00 ***} & \cellcolor{gray!10}{3.6e-10 ***} & \cellcolor{gray!10}{9.2e-08 ***}\\
#> \addlinespace
#> RRD & NCC & 1.9e-03 *** & 1e-02 *** & 0e+00 *** & 1.7e-04 *** & 5.8e-04 ***\\
#> \cellcolor{gray!10}{RRD} & \cellcolor{gray!10}{CHR} & \cellcolor{gray!10}{2.2e-03 ***} & \cellcolor{gray!10}{0e+00 ***} & \cellcolor{gray!10}{0.23} & \cellcolor{gray!10}{0.11} & \cellcolor{gray!10}{0.14}\\
#> RRD & SR & 0e+00 *** & 0e+00 *** & 0e+00 *** & 5.8e-12 *** & 2.6e-07 ***\\
#> \cellcolor{gray!10}{RRD} & \cellcolor{gray!10}{MDR} & \cellcolor{gray!10}{0e+00 ***} & \cellcolor{gray!10}{0e+00 ***} & \cellcolor{gray!10}{0e+00 ***} & \cellcolor{gray!10}{0e+00 ***} & \cellcolor{gray!10}{0e+00 ***}\\
#> NCC & CHR & 0.24 & 0.17 & 0.24 & 0.29 & 0.32\\
#> \addlinespace
#> \cellcolor{gray!10}{NCC} & \cellcolor{gray!10}{SR} & \cellcolor{gray!10}{4.3e-02 **} & \cellcolor{gray!10}{1e-02 ***} & \cellcolor{gray!10}{1e-02 ***} & \cellcolor{gray!10}{5.9e-02 *} & \cellcolor{gray!10}{8e-02 *}\\
#> NCC & MDR & 1.3e-14 *** & 0e+00 *** & 0e+00 *** & 5.3e-14 *** & 1.8e-10 ***\\
#> \cellcolor{gray!10}{CHR} & \cellcolor{gray!10}{SR} & \cellcolor{gray!10}{2.1e-02 **} & \cellcolor{gray!10}{5e-02 **} & \cellcolor{gray!10}{4e-02 **} & \cellcolor{gray!10}{1.1e-02 **} & \cellcolor{gray!10}{3.4e-02 **}\\
#> CHR & MDR & 3.2e-12 *** & 0e+00 *** & 0e+00 *** & 2.4e-12 *** & 1.5e-08 ***\\
#> \cellcolor{gray!10}{SR} & \cellcolor{gray!10}{MDR} & \cellcolor{gray!10}{1.8e-07 ***} & \cellcolor{gray!10}{0e+00 ***} & \cellcolor{gray!10}{0e+00 ***} & \cellcolor{gray!10}{6e-05 ***} & \cellcolor{gray!10}{4.1e-04 ***}\\
#> \bottomrule
#> \end{tabular}
#> \end{table}
#> ```